


Euro, EUR/USD, US Dollar, Trend, Momentum, Bollinger Bands - Talking points
- EUR/USD has crumbled below some simple moving averages
- While still in the range, the lower bound is being inspected by the bears
- If the US Dollar contuse to rally, will bearish momentum build in EUR/USD?
Trade Smarter - Sign up for the DailyFX Newsletter
Receive timely and compelling market commentary from the DailyFX team
EUR/USD TECHNICAL ANALYSIS
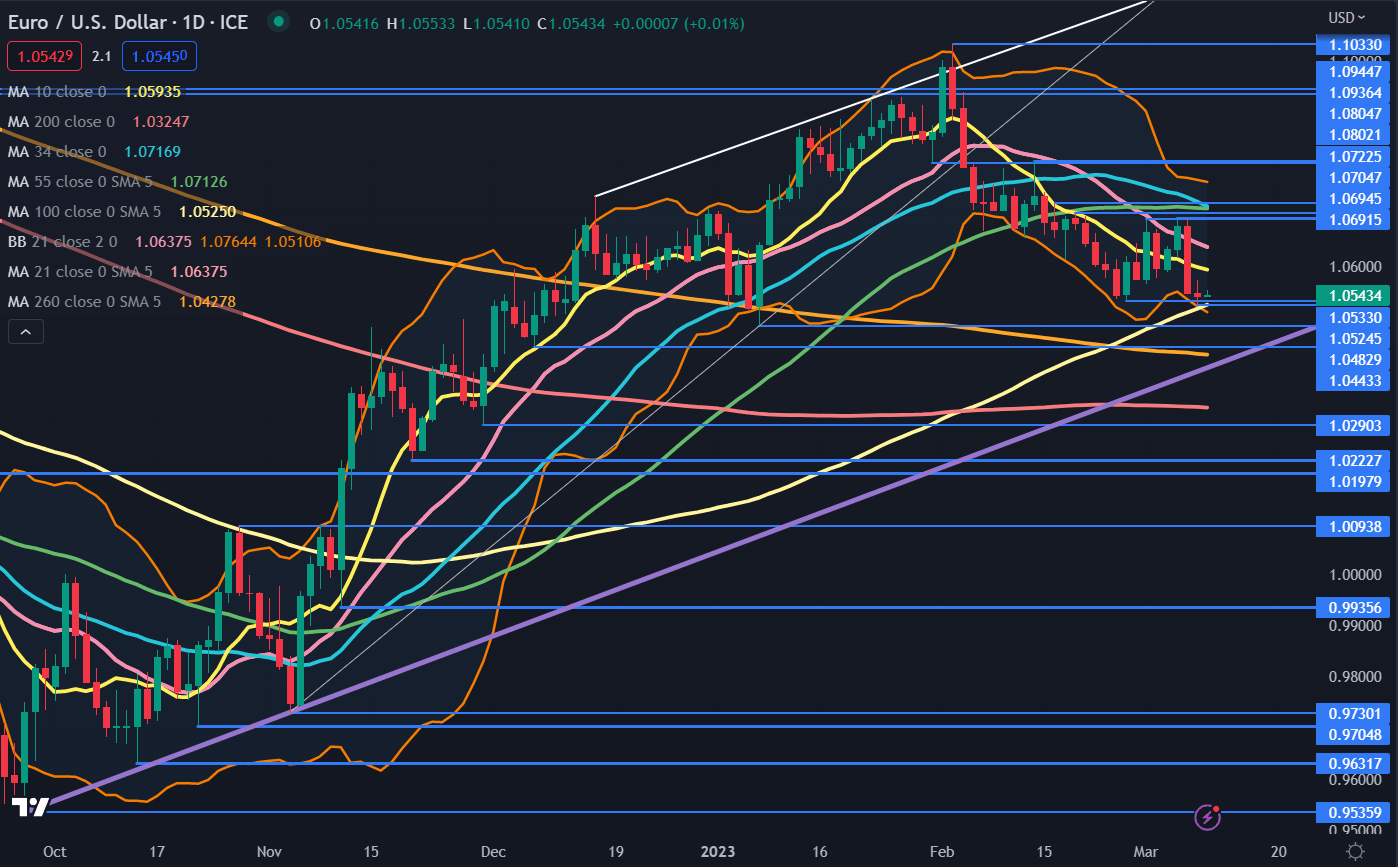
EUR/USD has been in a 1.0524 – 1.0722 range for three weeks despite several attempts to overcome both the topside and lower end of this range.
The peaks have setup potential resistance in the 1.0700 – 1.0720 area while the lows appear to be under threat but might provide near-term support in the 1.0524 – 1.0533 zone.
Overall, EUR/USD remains in an ascending trend channel and support could be at the lower bound of the channel, currently at 1.0410. Ahead of there, the previous lows of 1.0483 and 1.0443 may lend support.
The snap lower in response to comments made by Federal Reserve Chair Jerome Powell saw the US Dollar rally more broadly with rising Treasury yields. The benchmark 2-year bond traded at its highest yield since June 2007 above 5% overnight.
The EUR/USD price broke below the 10- and 21-day simple moving averages (SMA) and remains below the 34- and 55-day SMAs.
The 34-day SMA appears to be about to cross below the 55-day SMA. If this happens, it will form a Death Cross.

The longer-term 100-, 200- and 260-day SMAs remain below the and may provide support. A break below all three would see the ascending trend line broken and might suggest that bearish momentum has picked up steam.
At the same time, if that move was to occur soon, the price would trade outside the lower band of the 21-day Simple Moving Average (SMA) based Bollinger Band.
This price action could confirm the start of a new trend if there are several closes outside the lower band. A close back inside the band may suggest a pause in the bearishness or a potential reversal.
At the very least, a widening of the bands might indicate the expanding volatility is possibly opening the opportunity for more choppy trading conditions.
Resistance could be further up at the breakpoints and prior peaks of 1.0805, 1.0936, 1.0945 and 1.1030.
--- Written by Daniel McCarthy, Strategist for DailyFX.com
To contact Daniel, use the comments section below or @DanMcCathyFX on Twitter


