


S&P 500, Dow Jones, Retail Trader Positioning, Technical Analysis – IGCS Wall Street Update
- Retail traders have been selling the Dow Jones amid recent gains
- Most investors remain long the S&P 500 as it eyes a rising wedge
- How might positioning influence Wall Street in the coming days?

A corner of Wall Street has been enjoying robust gains since early October – the Dow Jones. While the S&P 500 is also trading higher since then, its performance is lacking in comparison. The push higher in US interest rates has been disproportionately impacting the tech sector while allowing blue-chip companies to better weather a potential economic downturn.
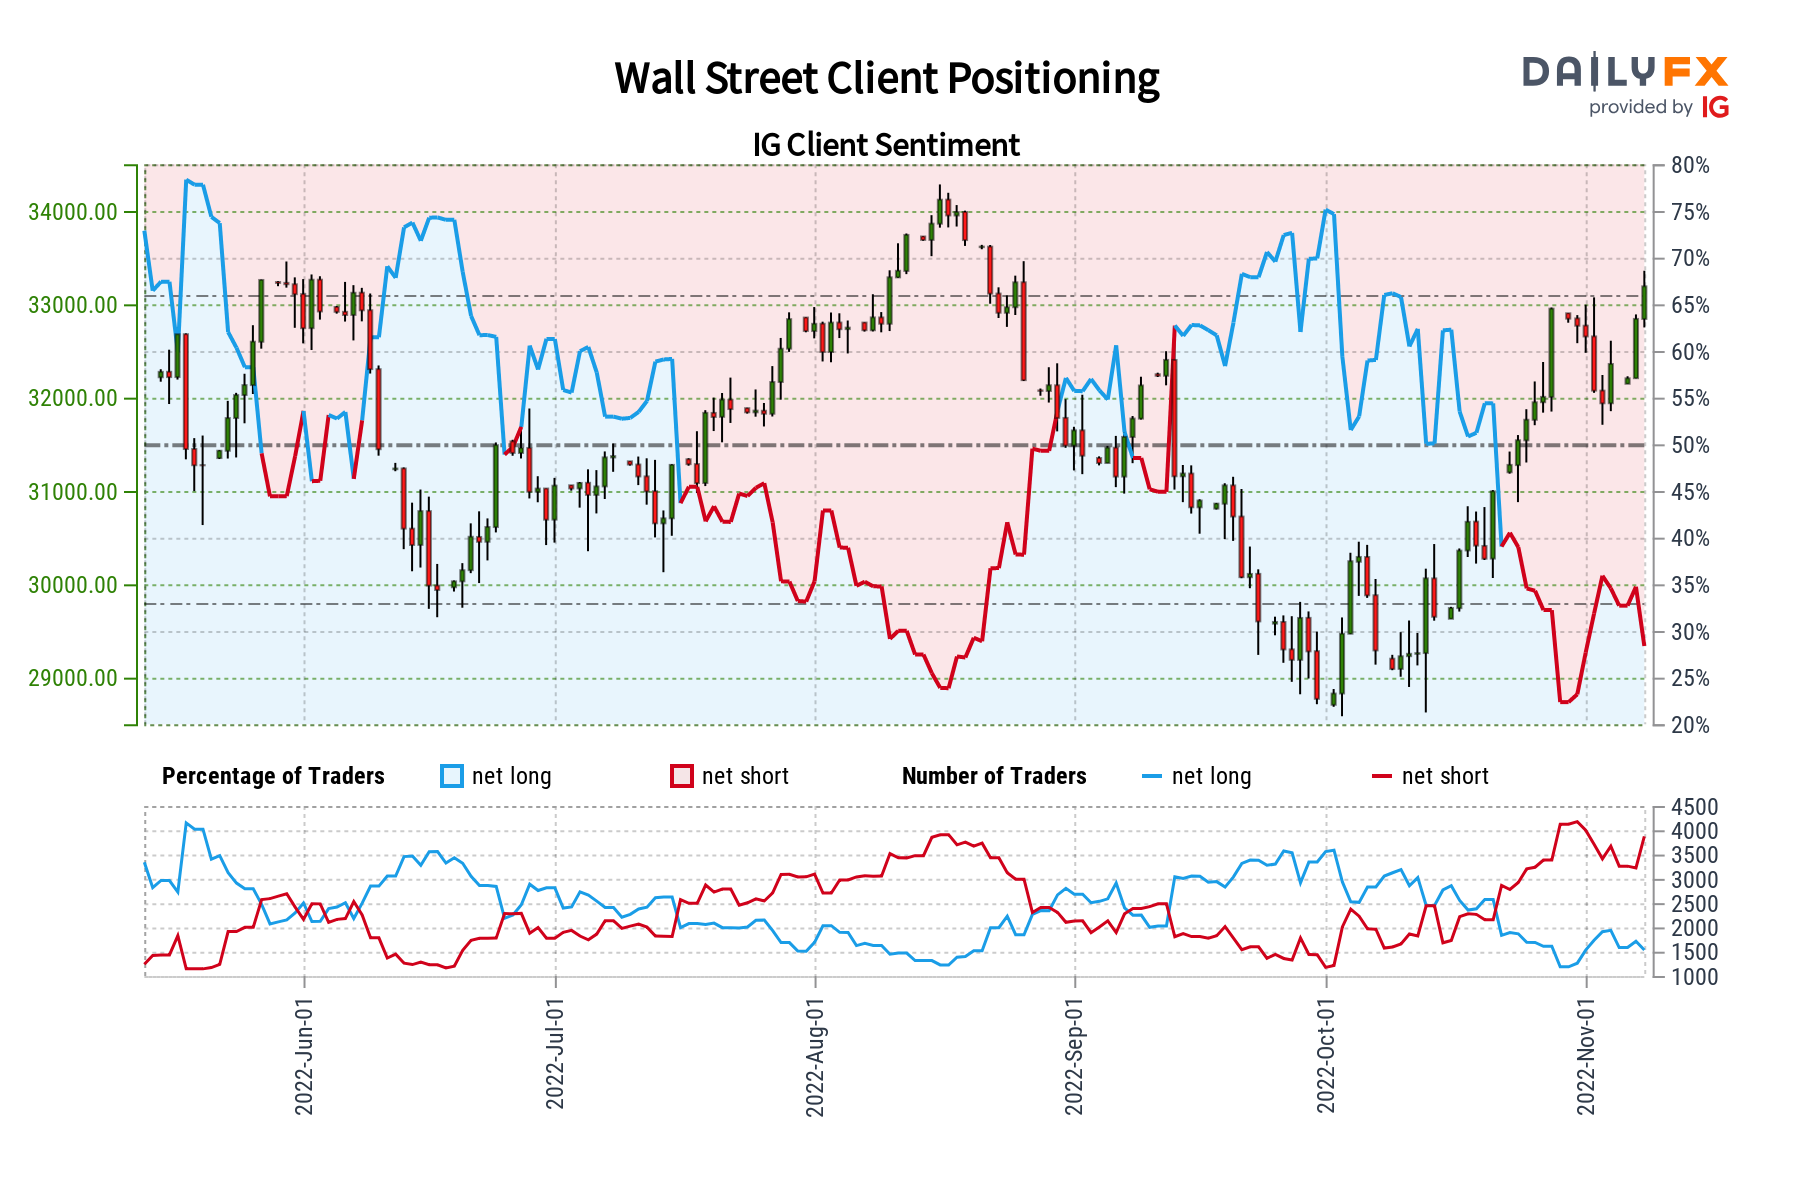
Broadly speaking, recent gains on Wall Street have seen retail traders continue to unwind their net-long exposure. This can be seen by looking at IG Client Sentiment (IGCS). IGCS tends to function as a contrarian indicator. If retail investors continue to dump upside bets and gather bearish exposure, this could end up supporting stocks ahead.
Dow Jones Sentiment Outlook - Bullish
The IGCS gauge shows that about 27% of retail traders are net-long the Dow Jones. Downside exposure has increased by 9.28% and 11.01% compared to yesterday and last week, respectively. Since most traders are net-short, this hints prices may continue rising. The combination of current sentiment and recent changes in positioning offers a stronger bullish contrarian trading bias.
Dow Jones Daily Chart
On the daily chart, Dow Jones futures have rallied to the key long-term falling trendline from the beginning of this year. A confirmatory breakout above the 33169 – 33434 resistance zone could open the door to a broader bullish bias. But negative RSI divergence shows that upside momentum is fading. A turn lower places the focus on rising support from September. Falling under it could reimpose a bearish bias.

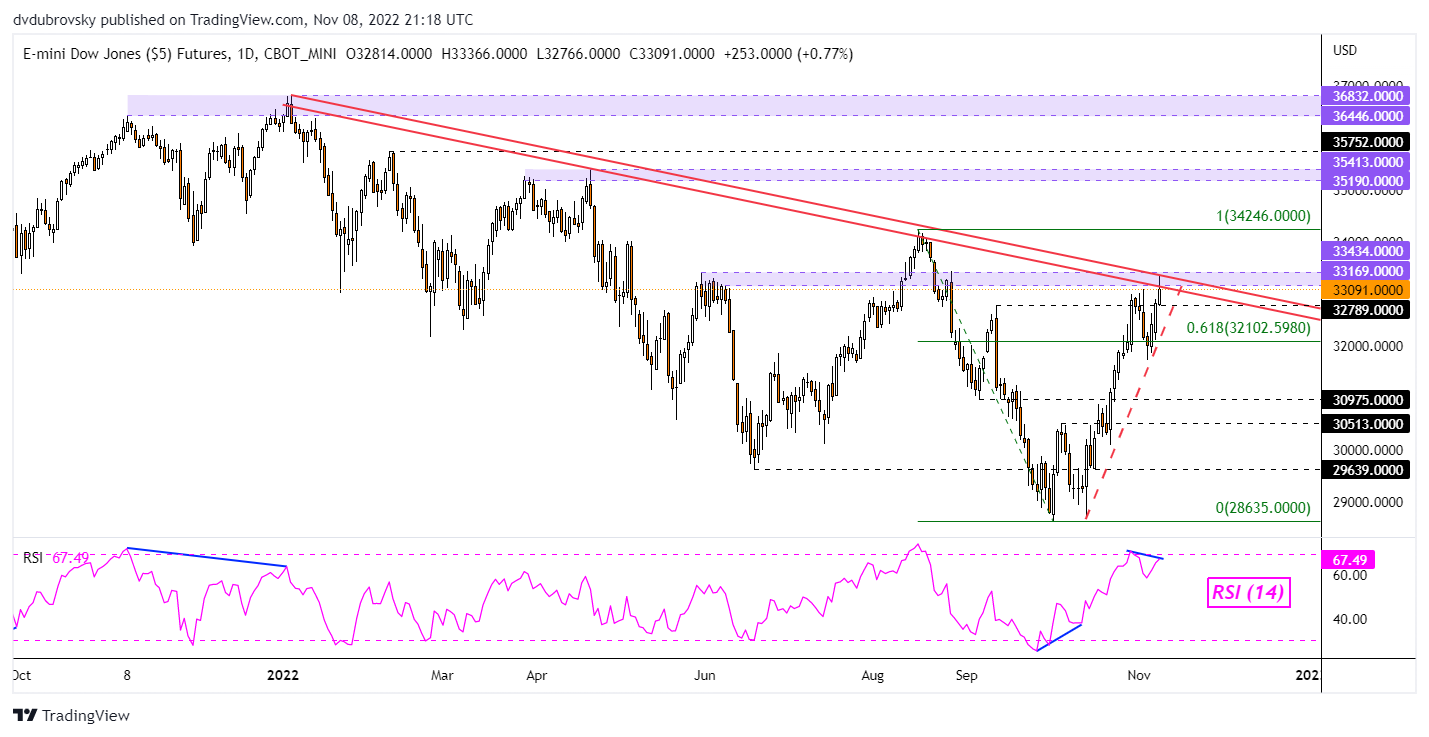
Chart Created in Trading View
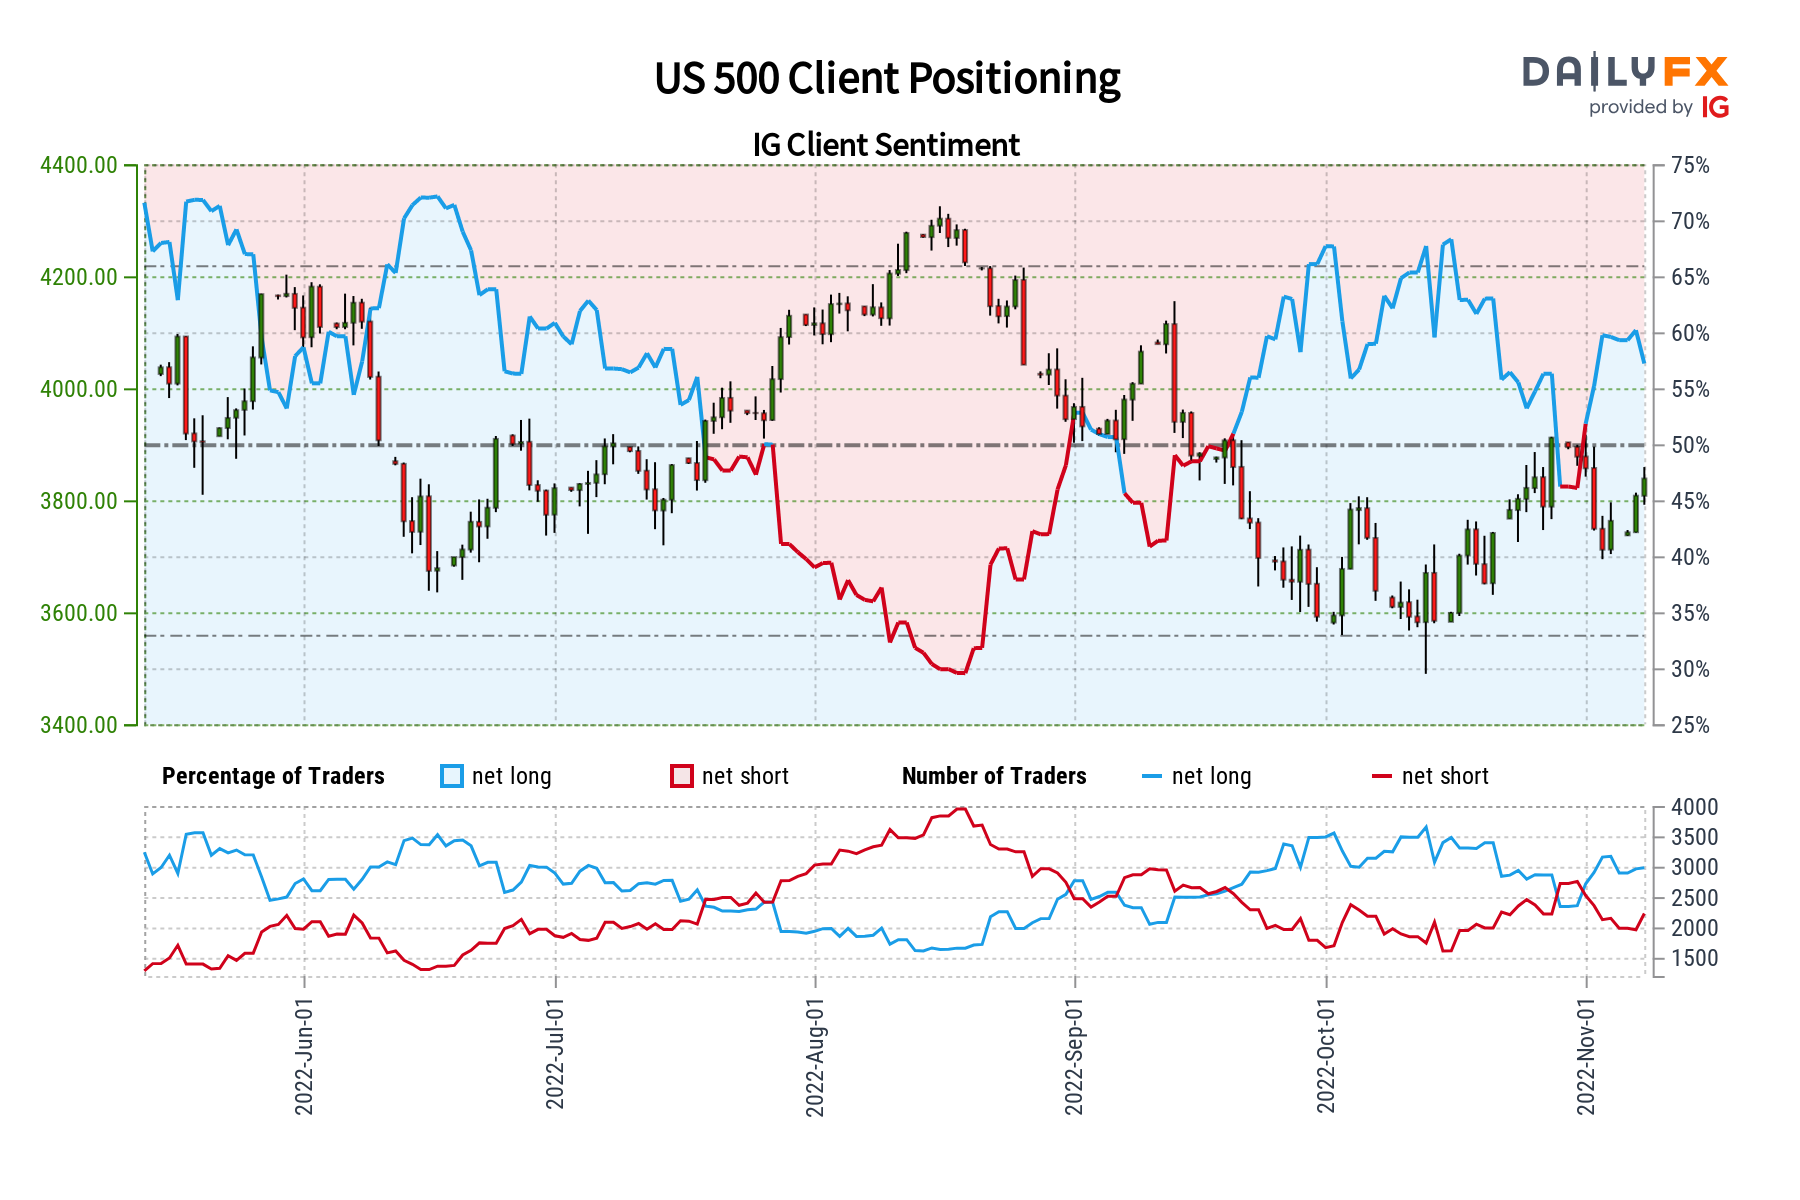
S&P 500 Sentiment Outlook - Mixed
The IGCS gauge shows that about 56% of retail traders are still net-long the S&P 500. Since most of them are biased higher, this suggests prices may continue falling. Upside exposure has decreased by 4.02% compared to yesterday while rising 2.51% versus last week. With that in mind, the combination of overall positioning and recent changes offers a further mixed trading bias.
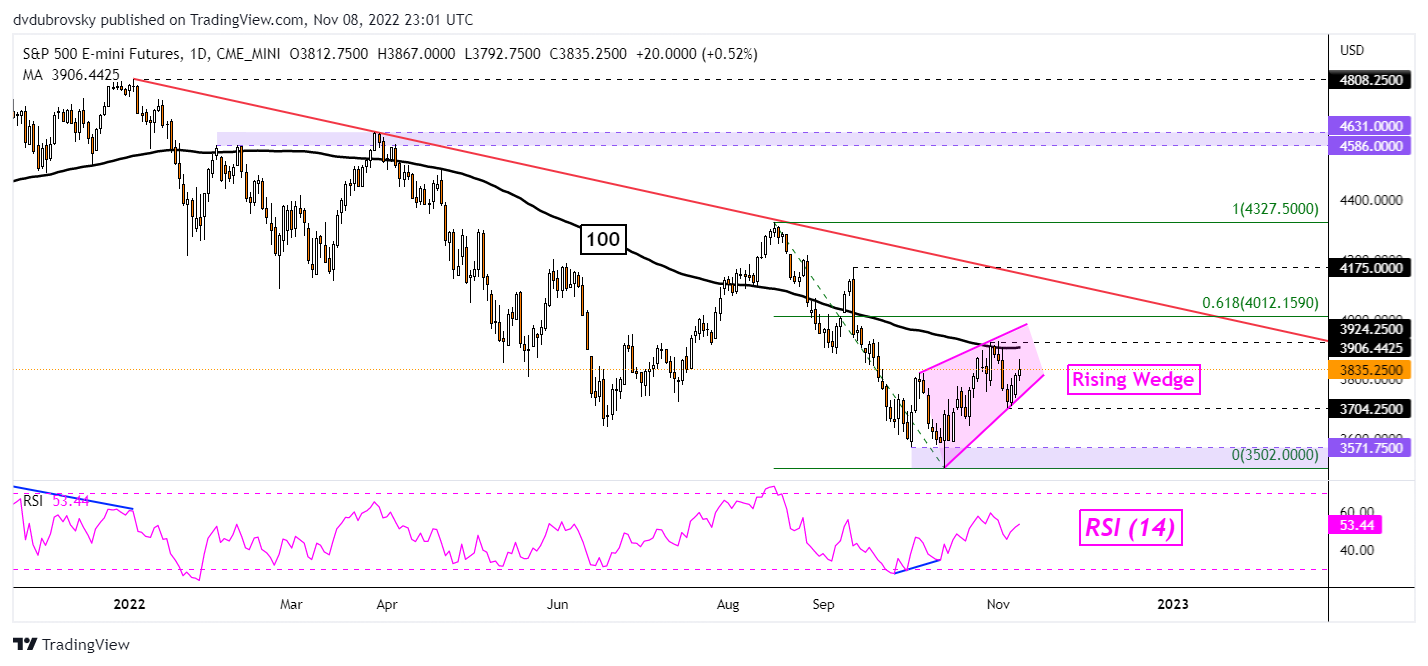
S&P 500 Daily Chart
On the daily setting, S&P 500 futures appear to be trading with a bearish Rising Wedge chart formation. A breakout under the pattern could open the door to extending the August – September downtrend. Since prices remain within the wedge at the time of publishing, the technical bias itself is neutral. Key resistance is the 100-day Simple Moving Average. Breaking higher opens the door to facing the falling trendline from January.

*IG Client Sentiment Charts and Positioning Data Used from November 8th Report
--- Written by Daniel Dubrovsky, Senior Strategist for DailyFX.com
To contact Daniel, follow him on Twitter:@ddubrovskyFX


