


Dow Jones, S&P 500, Retail Trader Positioning, Technical Analysis – IGCS Wall Street Update
- The Dow Jones and S&P 500 have been falling recently
- Retail traders responded by boosting upside exposure
- Is that a warning sign that more pain might be ahead?

In recent days, Dow Jones and S&P 500 futures have been taking cautious losses. This followed a solid US non-farm payrolls report last week and strong ISM services data on Monday. That helped boost hawkish Federal Reserve policy expectations. Looking at IG Client Sentiment (IGCS), retail traders have been responding by selling equities. IGCS tends to function as a contrarian indicator. With that in mind, is more pain ahead for Wall Street?
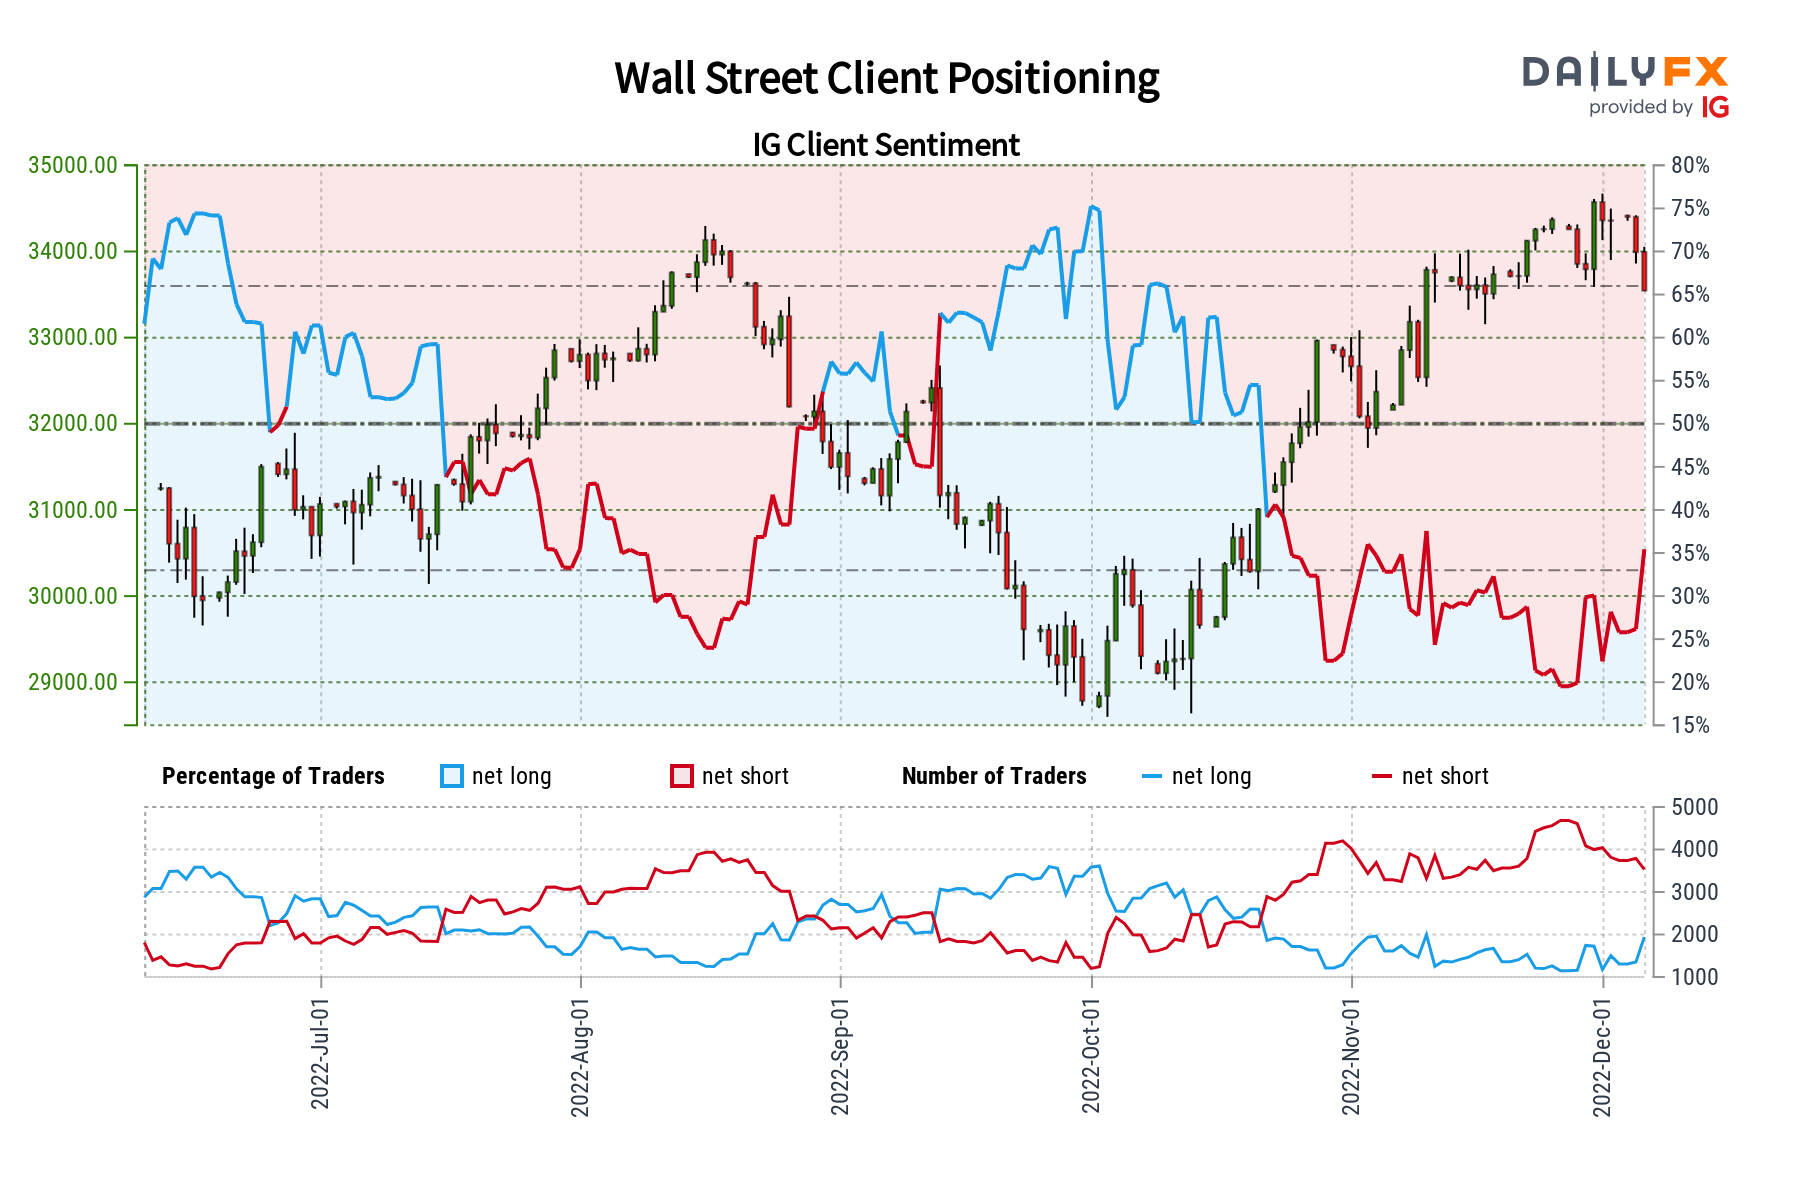
Dow Jones Sentiment Outlook - Bearish
The IGCS gauge shows that about 38% of retail traders are net-long the Dow Jones. Since most traders are still biased to the downside, this hints prices may continue rising. However, upside exposure has increased by 14.39% and 22.81% compared to yesterday and last week, respectively. With that in mind, recent changes in positioning hint that the price trend may soon reverse lower.
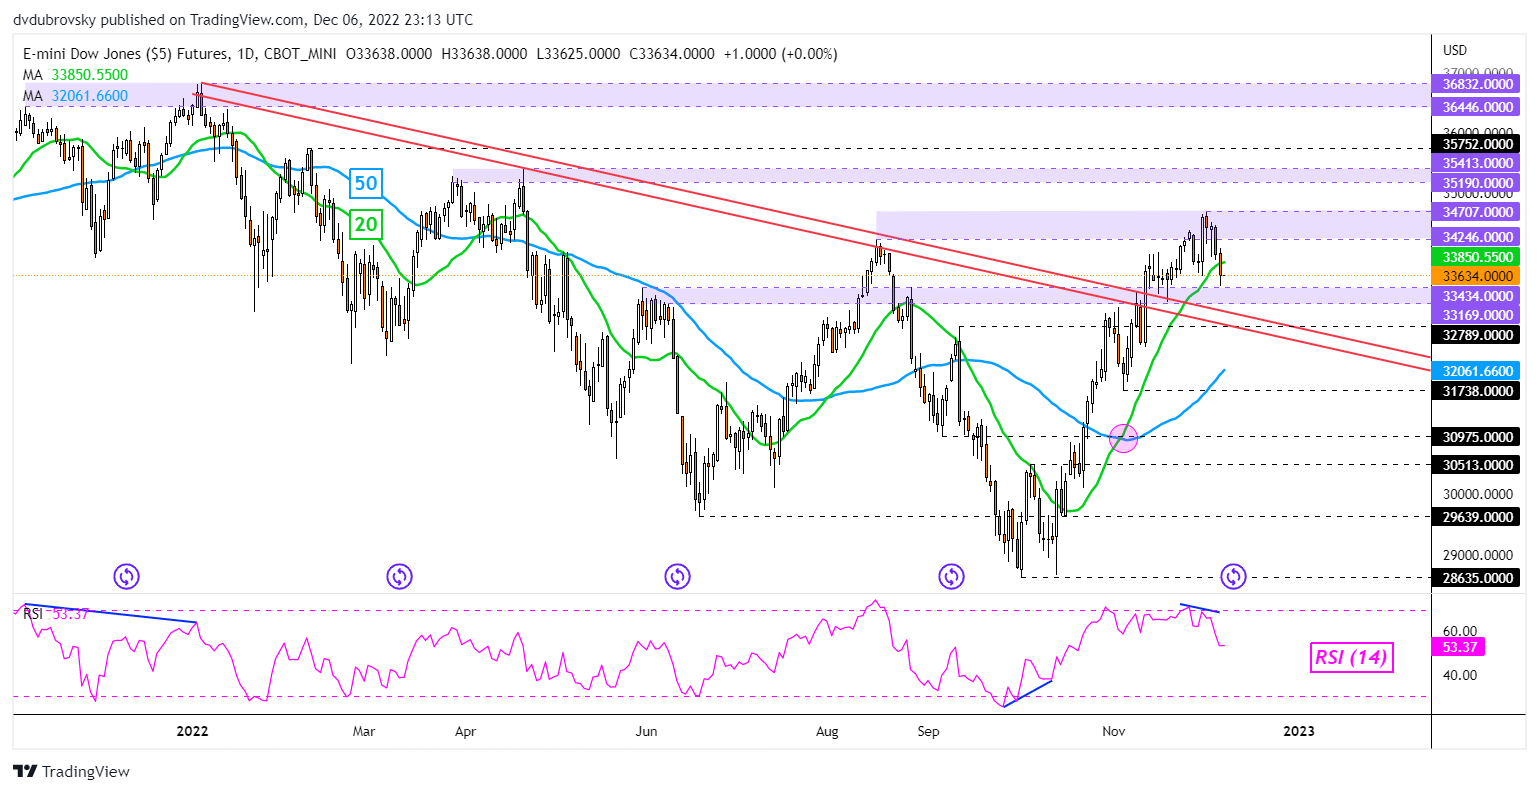
Dow Jones Daily Chart
Dow Jones futures broke under the 20-day Simple Moving Average (SMA) after establishing resistance between 34246 and 34707. A confirmatory downside close could open the door to extending losses towards the 50-day SMA. Getting there entails clearing immediate support which is the 33169 – 33434 inflection zone. Pushing back above resistance would place the focus on the uptrend since October, exposing highs from April.

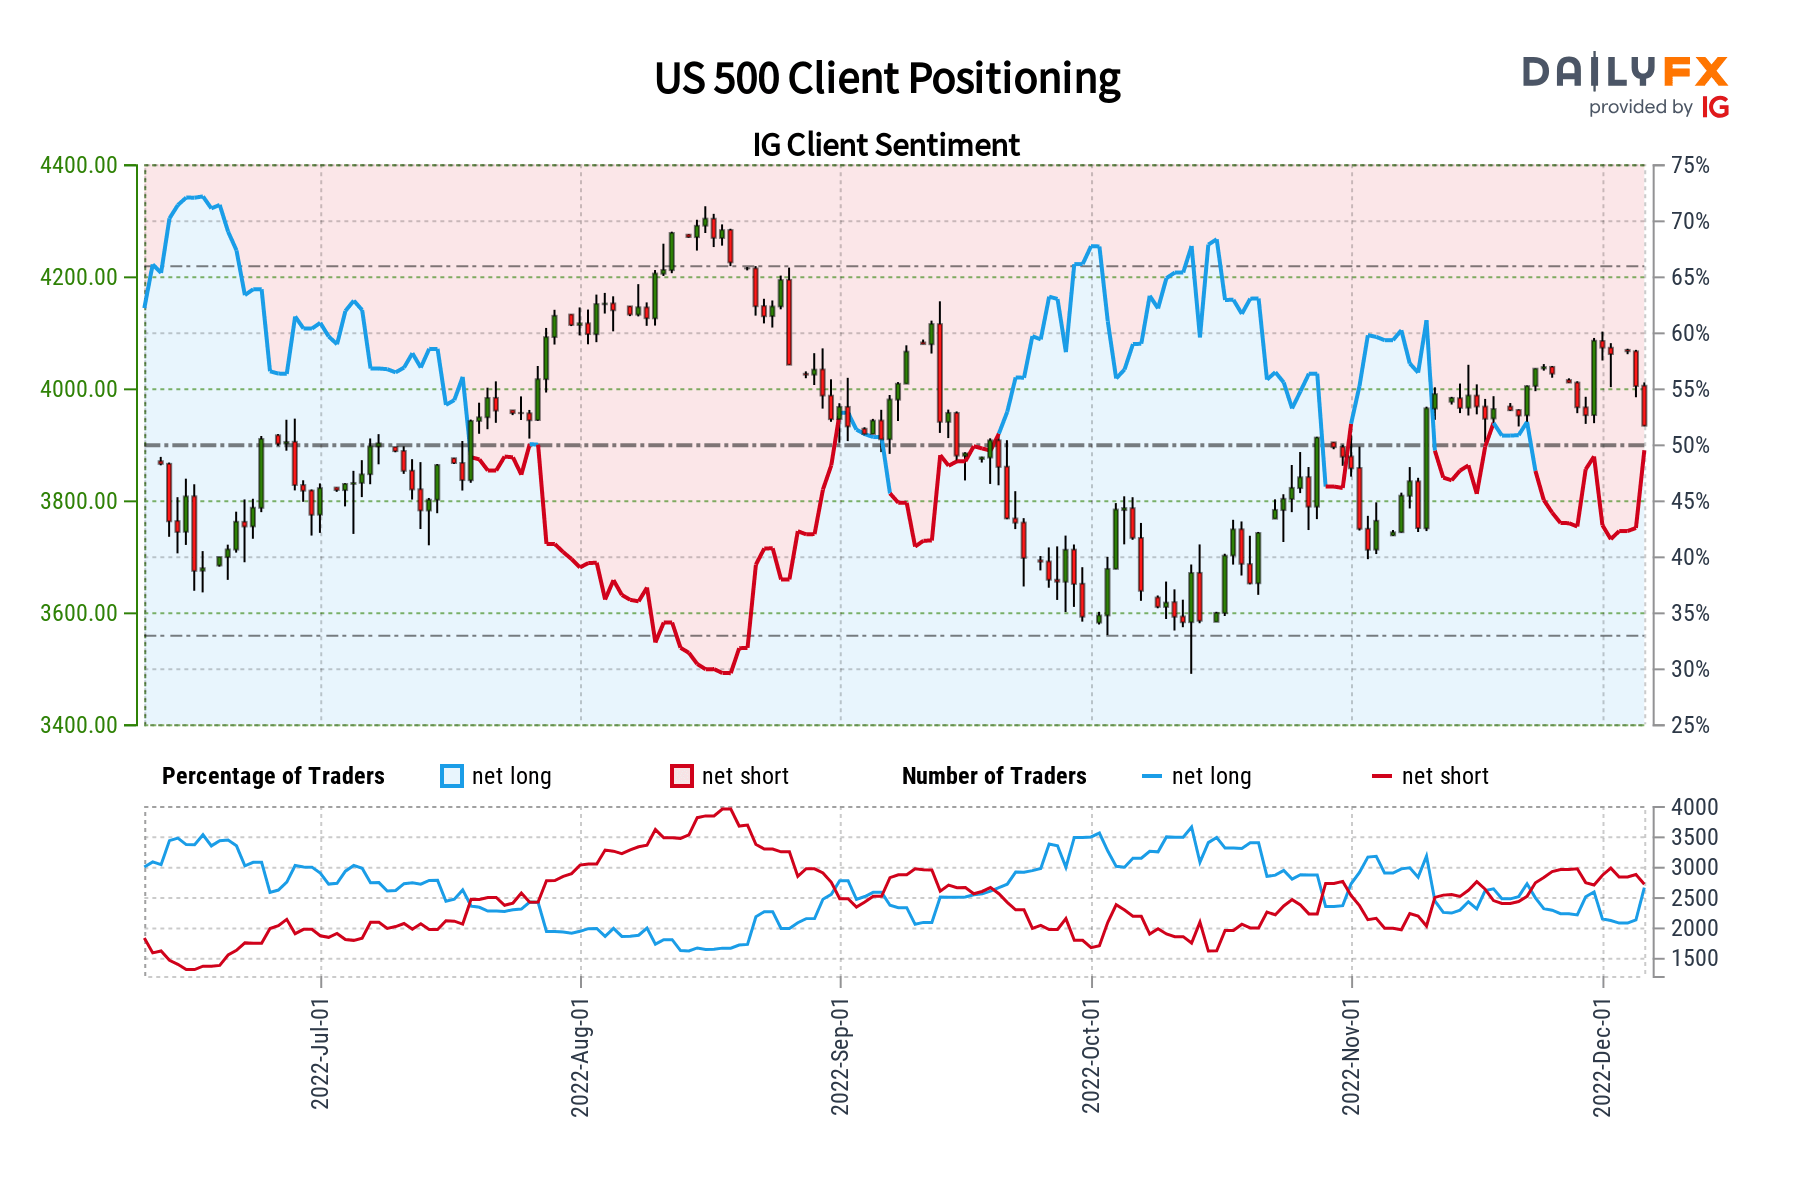
S&P 500 Sentiment Outlook - Bearish
The IGCS gauge shows that about 51% of retail traders are net-long the S&P 500. Since most traders are now biased higher, this hints that prices may continue falling. Upside exposure has increased by 14.40% and 9.41% compared to yesterday and last week, respectively. With that in mind, overall positioning and recent changes to exposure offer a stronger bearish contrarian trading bias.
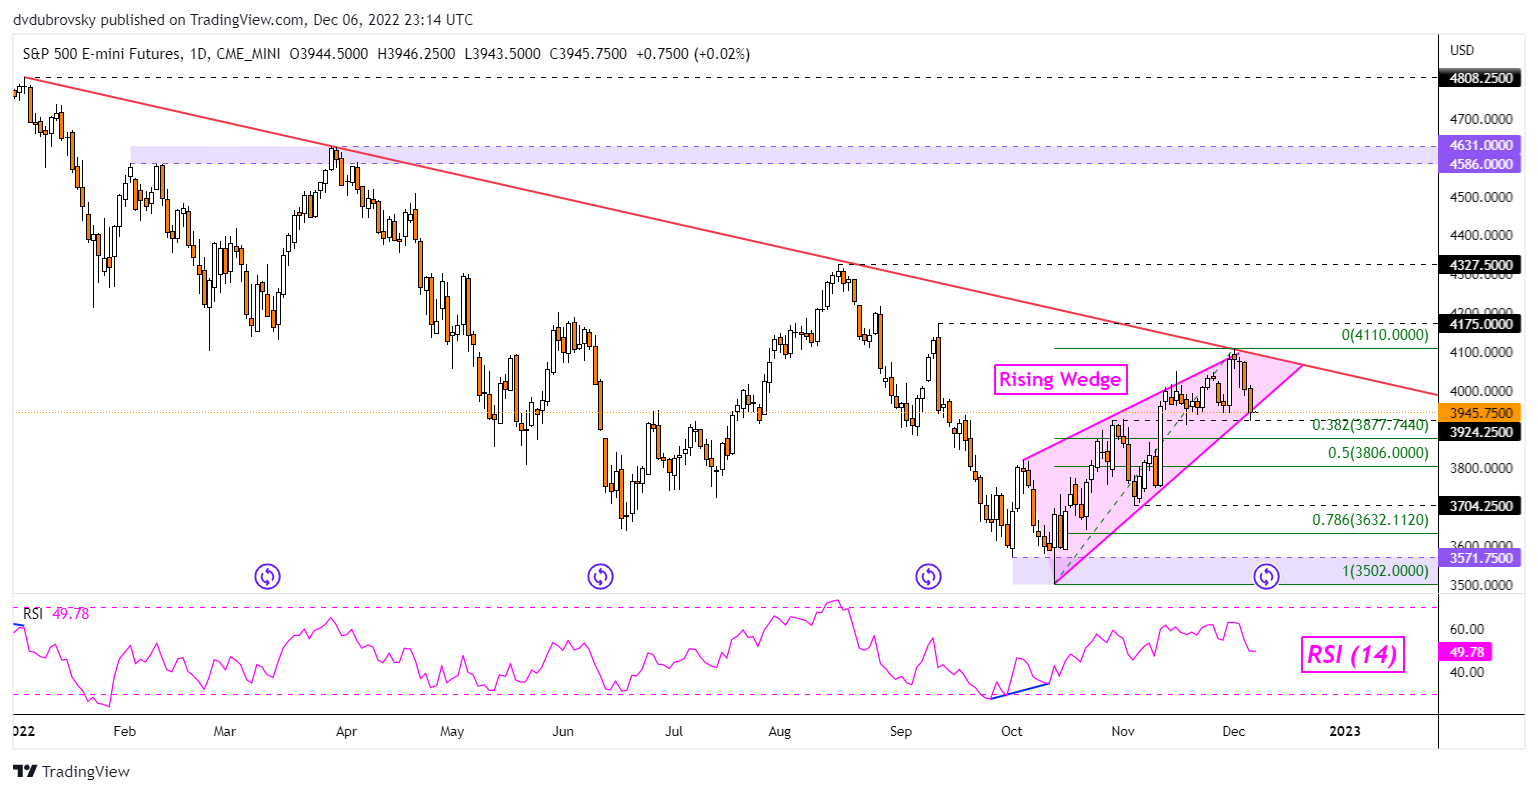
S&P 500 Daily Chart
S&P 500 futures are testing the floor of a bearish Rising Wedge shortly after prices were unable to push above falling resistance from the beginning of this year. The wedge has been brewing since October and a breakout lower could open the door to extending losses. In such an outcome, the index could revisit lows from October. Otherwise, clearing the falling trendline from January would place the focus on the December 1st high at 4110.
*IG Client Sentiment Charts and Positioning Data Used from December 6th Report
--- Written by Daniel Dubrovsky, Senior Strategist for DailyFX.com
To contact Daniel, follow him on Twitter:@ddubrovskyFX


