


Canadian Dollar, USD/CAD and EUR/CAD Talking Points:
- USD/CAD Technical Outlook: Neutral.
- EUR/CAD Technical Outlook: Bullish.
- USD/CAD Further Downside in Store if Price Remains Below YTD High 1.3838.
- EUR/CAD Monthly Chart Morningstar Reversal Pattern Hints at Further Upside. BoC and ECB Rate Differential May Help Cap Gains.

Canadian Dollar Outlook
Strong job numbers came out of Canada on Friday in what will be seen as vindication for Bank of Canada (BOC) Governor Tiff Macklem. During the week the BoC governor reiterated his belief that further rate hikes will be needed despite the recent slowdown in inflation numbers. Governor Macklem stated that there is more to be done as inflation wouldn’t fade away on its own. He warned that price pressures run the risk of becoming entrenched. These comments by Macklem do suggest that the BoC will not get left behind should the US Federal Reserve continue its aggressive hiking path. A continued rally in oil prices could see further strength added to the Canadian Dollar for the week ahead and might be worth keeping an eye on.
Foundational Trading Knowledge
Trading Discipline
Recommended by Zain Vawda
Technical Outlook
USDCAD Daily Chart
Source: TradingView, prepared by Zain Vawda
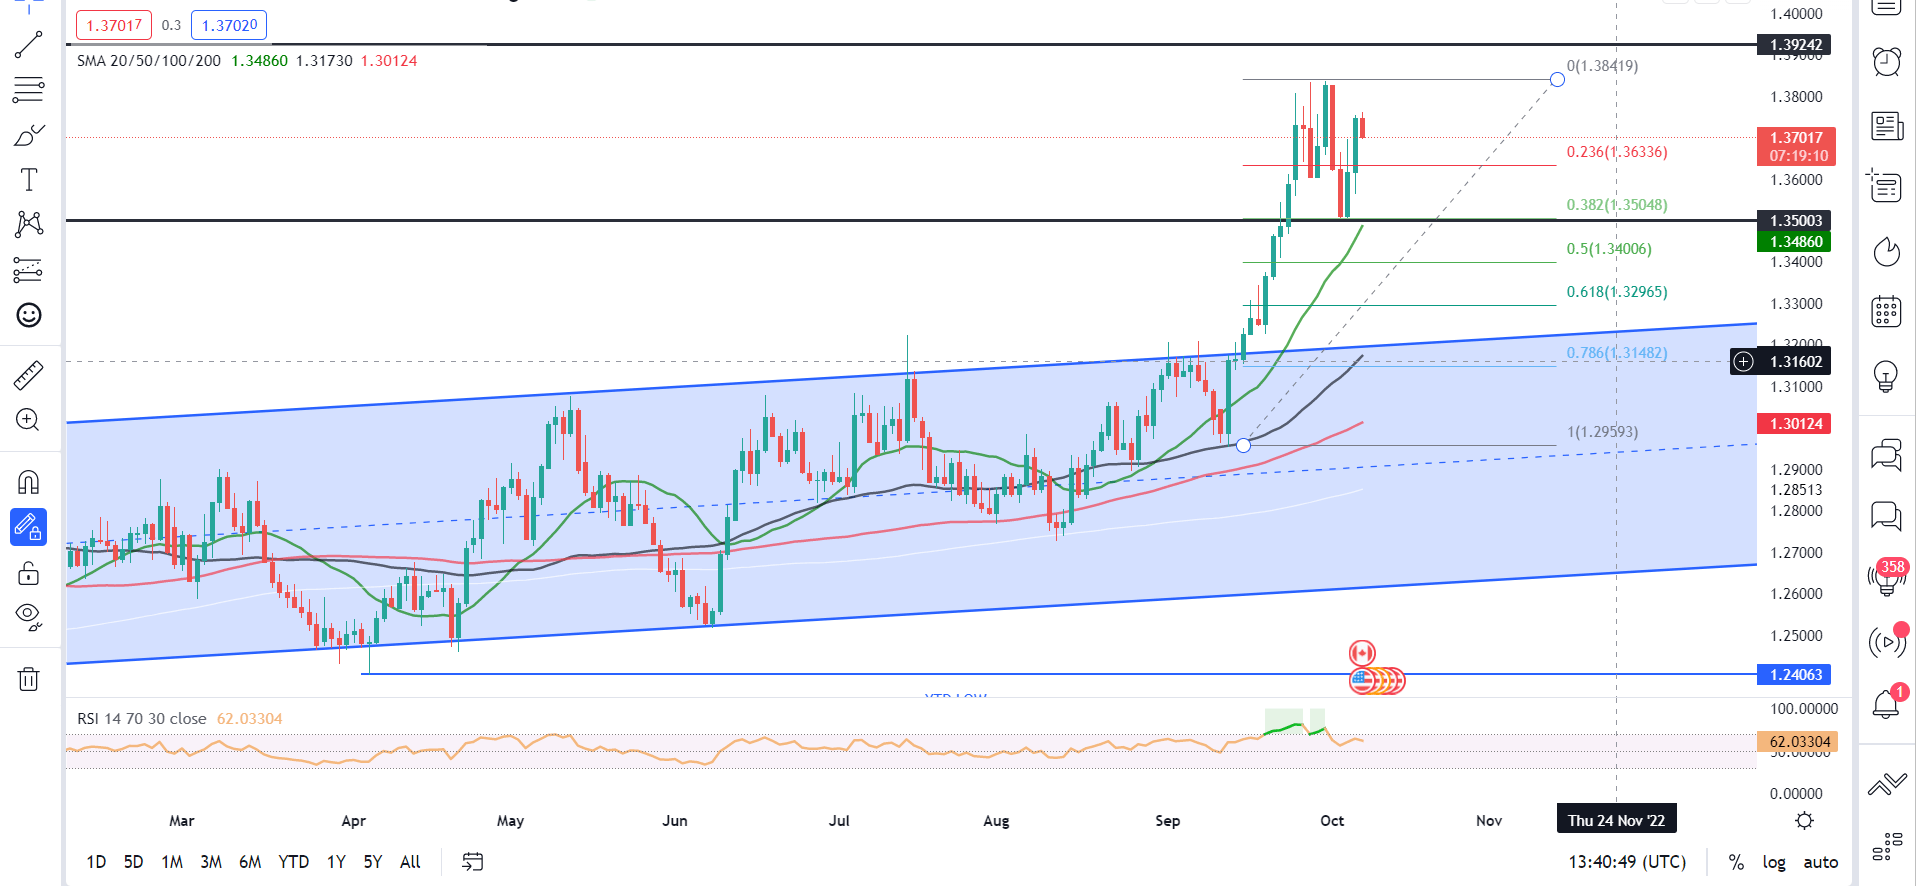
From a technical perspective, USD/CAD has seen a 300-odd pip retracement since its most recent YTD high around September 30th (see chart). Price action on the daily timeframe has been indecisive to say the least as we have taken out the previous higher low swing point (indicating a change to bearish structure) before tapping into the 1.3500 psychological level. Thereafter we had a bullish engulfing daily candle close before pushing on, a sign that the bulls may be back in control.
Looking at the bigger picture, the upside rally into the YTD highs was aggressive with the 50 and 100-SMA lagging well behind current price. A push further down remains a possibility if price remains below the YTD high with a retest of the 50 and 100-SMA on the cards. Friday’s weekly candle close remains key, with a candle close as a hanging man candlestick indicating potential for further downside in the week ahead. There remains a host of confluences in play around the 1.3150-1.3300 area which lines up with 78.6% fib level, 50-SMA as well as the top of the ascending channel.
| Change in | Longs | Shorts | OI |
| Daily | -2% | 7% | 5% |
| Weekly | -30% | 38% | 13% |
EURCAD Daily Chart
Source: TradingView, prepared by Zain Vawda
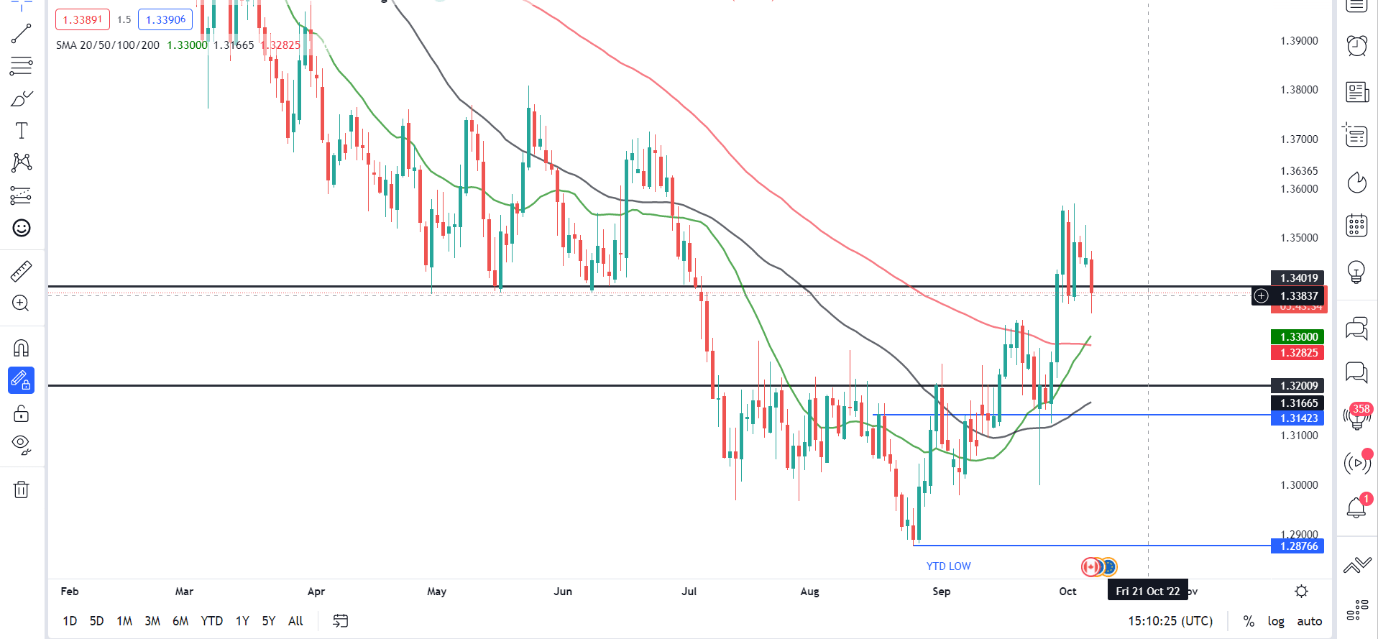
From a technical perspective, EURCAD has been on a tear since bottoming out at around the 1.28760 area. We have since had a significant upside rally of around 680-odd pips with September’s monthly candle closing as a hammer candlestick and completing a morning star reversal candlestick pattern. The current weekly candle however presents an obstacle as it looks likely that we will see a bearish inside bar candle close which would indicate the potential for further downside in the week ahead.
The daily timeframe provides a wonderful indication of price action at work, as we have steadily moved higher creating higher highs and higher lows. The moving averages have provided support as we have stair cased higher with the price currently above the 20, 50 and 100-SMA. Price action on the daily indicates that a pullback may be in store for the pair with the 1.3200 psychological level right in the middle of the moving averages which provides an extra layer of confluence. On the flip side a daily candle break and close below the 1.3150 area will result in the bullish structure being invalidated, with bears potentially taking control.
Trade Smarter - Sign up for the DailyFX Newsletter
Receive timely and compelling market commentary from the DailyFX team
Resources For Traders
Whether you are a new or experienced trader, we have several resources available to help you; indicators for tracking trader sentiment, quarterly trading forecasts, analytical and educational webinars held daily, trading guides to help you improve trading performance, and one specifically for those who are new to forex.
--- Written by Zain Vawda for DailyFX.com
Contact and follow Zain on Twitter: @zvawda


