


Bitcoin, BTC/USD - Technical Outlook:
- Bitcoin’s medium-term downward pressure is fading.
- However, the given the damage since 2021, the recovery is likely to be characterized as “two-steps-forward-one-step-back”.
- What are the key levels to watch?

BITCOIN TECHNICAL OUTLOOK - BULLISH
Bitcoin’s break earlier this month above a four-year moving average has raised the odds that the medium-term downward pressure is fading. However, the unwinding of a year-long slide could be prolonged and bumpy.
Earlier this month, BTC/USD rebounded from near strong converged cushion at 19500-21400 (including the 200-day moving average, the 89-day moving average, and the lower edge of the Ichimoku cloud on the daily charts. Within the overall context, the retreat in February was part of the consolidation and not a reversal of the uptrend.See the previous update highlighting the key support area and the overall bullish bias.
BTC/USD Weekly Chart
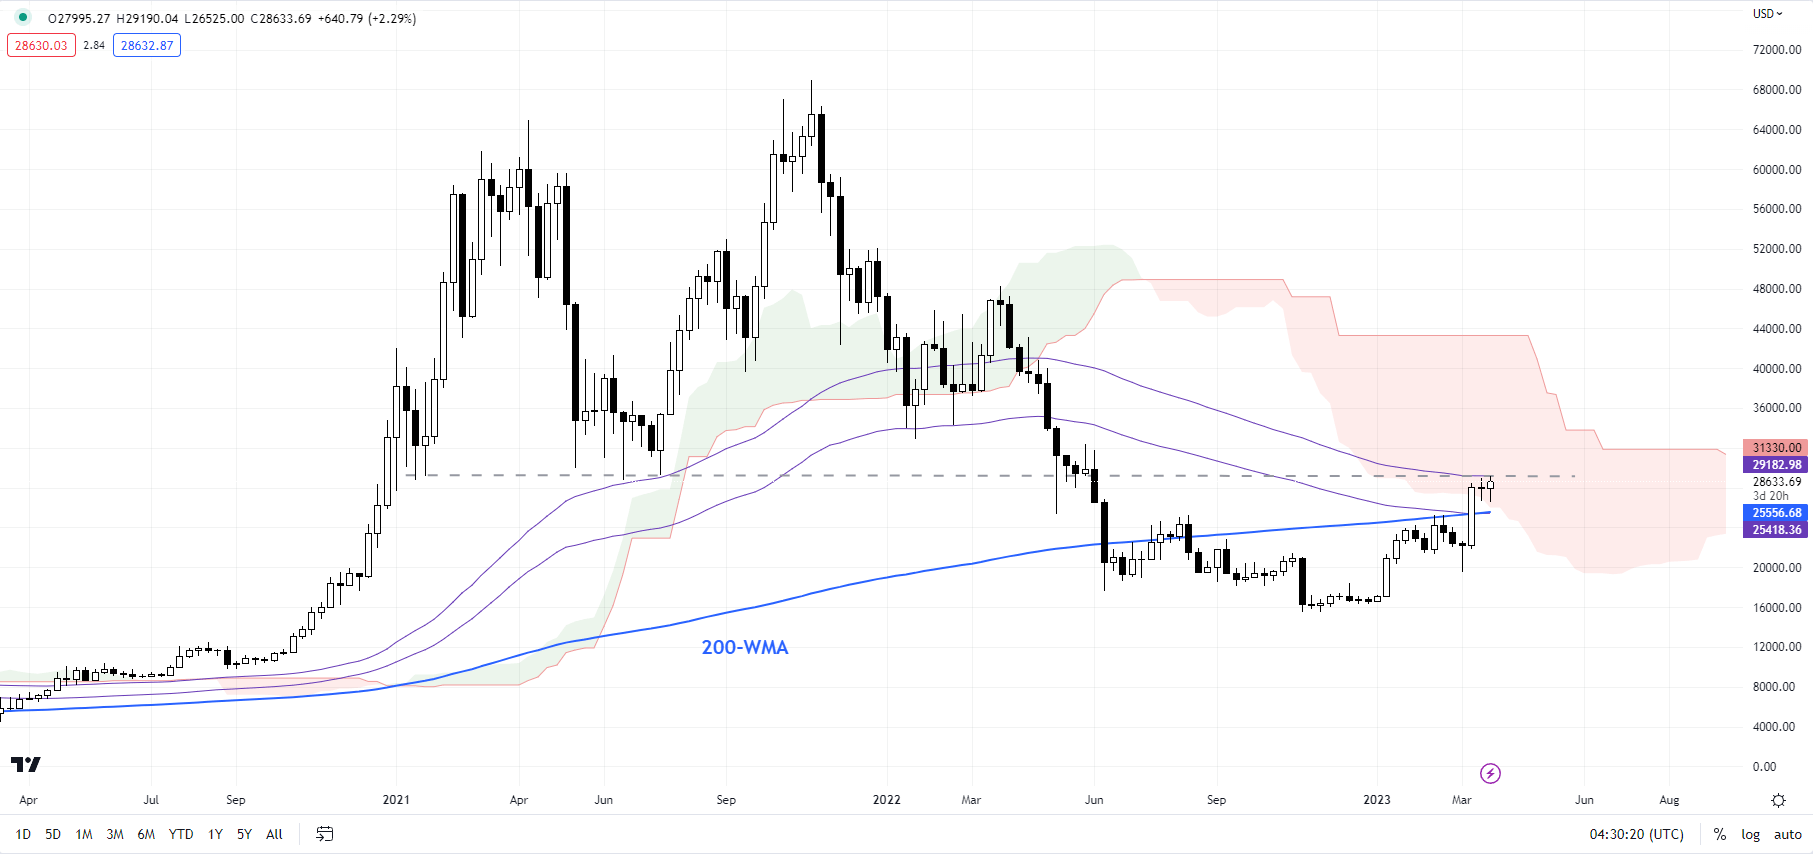
Chart Created Using TradingView
The subsequent break above the February high of 25250 to a new nine-month high also coincided with a move above the 200-week moving average. The rise above the four-year average has raised the odds that the medium-term downward pressure is fading. (See the mid-January updatefor more details.) Importantly, the developments on charts in recent weeks confirm that cryptocurrencies are in the process of building a base. (See the mid-November update).
BTC/USD Daily Chart
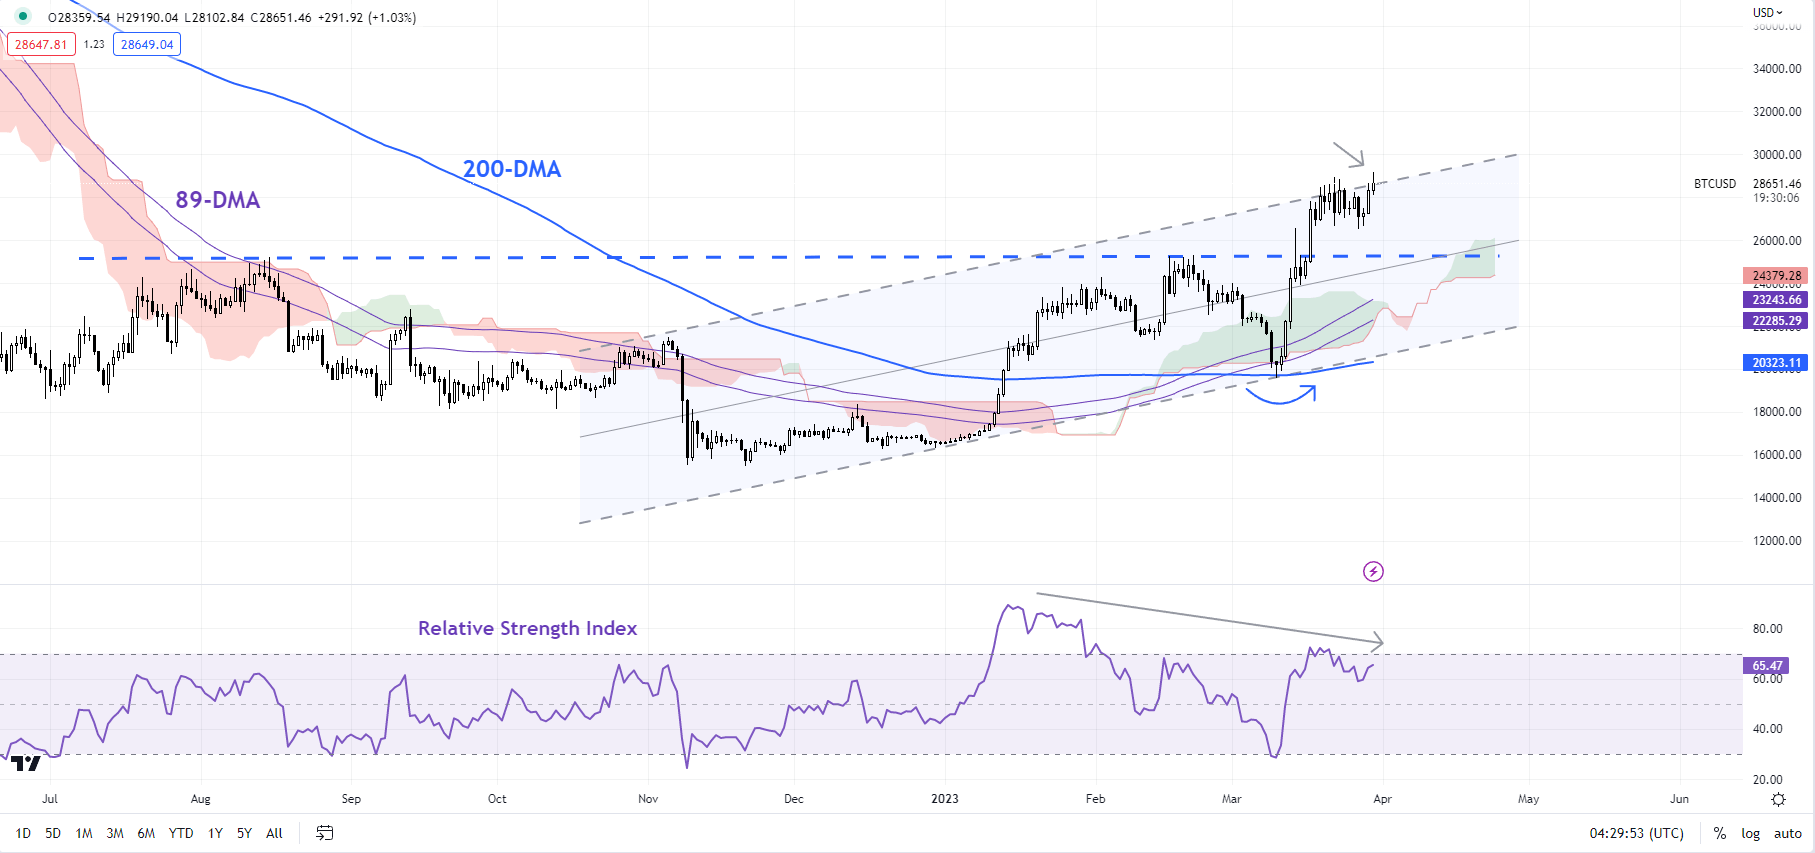
Chart Created Using TradingView
BTC/USD is now testing yet another ceiling: the June 2021 low of 28800, coinciding with the 89-week moving average, near the top end of a rising channel from the end of 2022. A negative momentum divergence (rising price associated with a stalling in momentum) implies that the rally is showing signs of fatigue in the near term.
BTC/USD 240-minute Chart
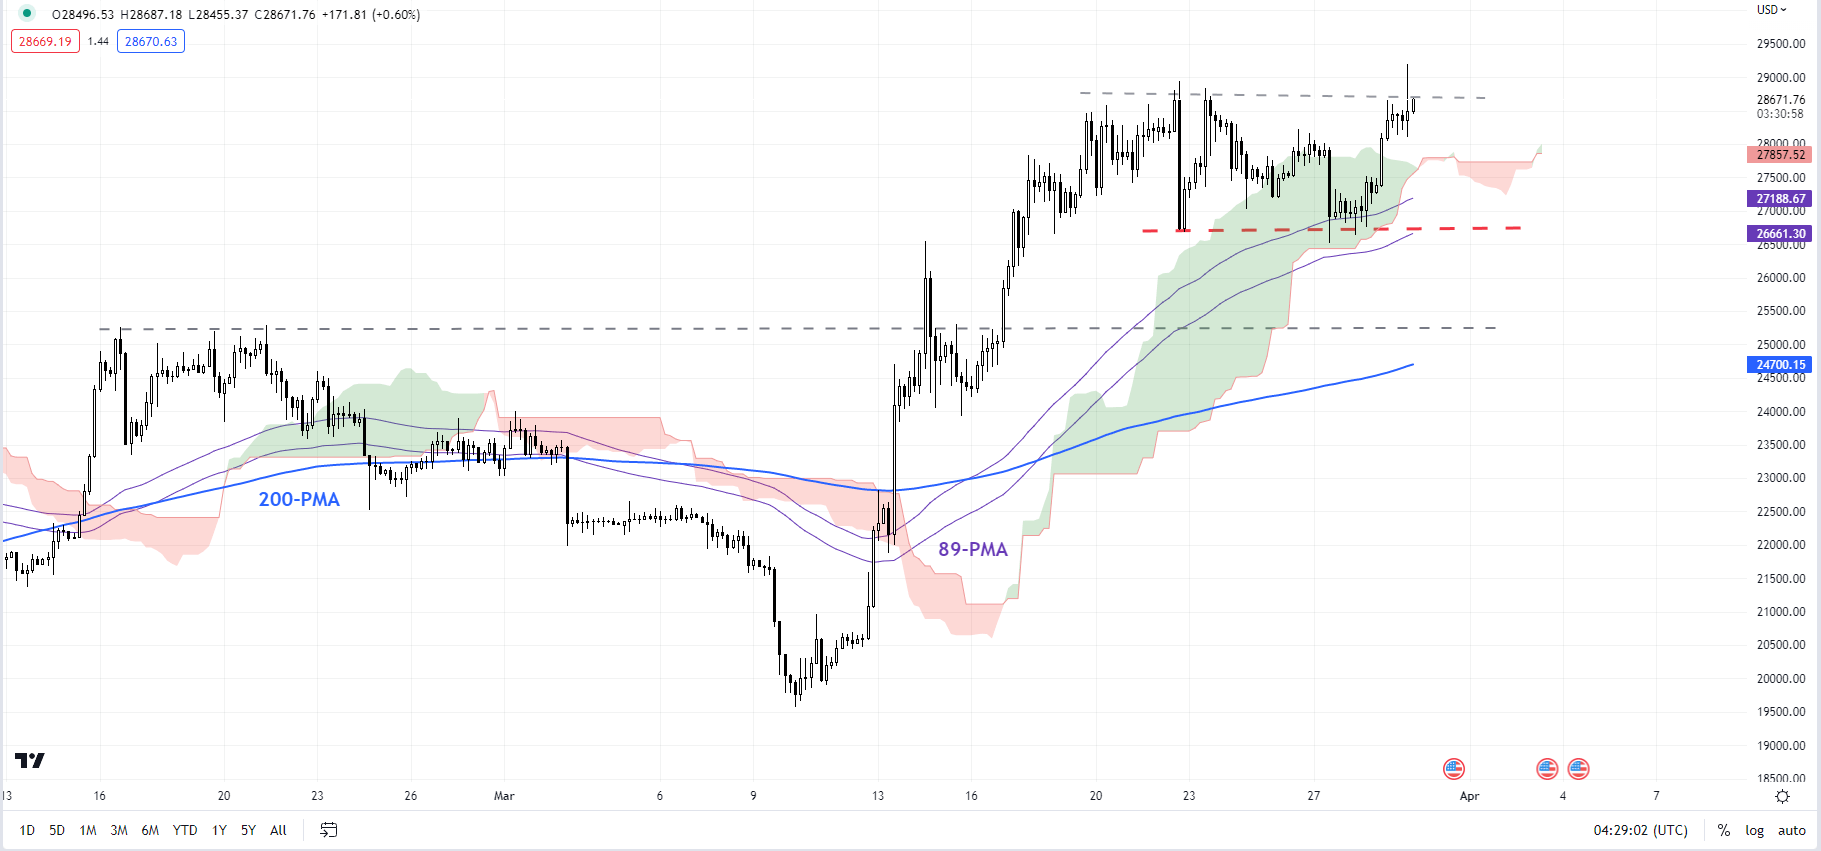
Chart Created Using TradingView
Any break below immediate support at Monday’s low of 26525 could open the way toward the 200-period moving average on the 240-minute chart (see chart). For the nascent upward trajectory to reverse, BTC/USD would need to fall below the early-March low of 19540. Until then, the ‘two-steps-forward-one-step-back’ nature of recovery could continue.
Trade Smarter - Sign up for the DailyFX Newsletter
Receive timely and compelling market commentary from the DailyFX team
--- Written by Manish Jaradi, Strategist for DailyFX.com
--- Contact and follow Jaradi on Twitter: @JaradiManish


