


Australian Dollar Vs US dollar, Japanese Yen, Euro – Price Setups:
- AUD appears to be setting a base in the interim.
- AUD/USD has rebounded from strong support; EUR/AUD has retreated from stiff resistance.
- AUD/JPY remains within its well-established range.
FckIT1afL7Y

Tentative signs are emerging on technical charts that the Australian dollar may have found an interim floor. However, AUD would need to do some more work to be out of the woods.
AUD rebounded on speculative short AUD positioning and oversold conditions after the Reserve Bank of Australia unexpectedly raised the benchmark rate by 25 basis points at its meeting last week and kept the door open for further tightening. See “Australian Dollar Price Action: AUD/USD, EUR/AUD, AUD/JPY, GBP/AUD”, published April 27, that highlighted the chance of a pause in AUD’s slide. Meanwhile, the US Federal Reserve raised interest rates by 25 basis points at its meeting last week but indicated a pause in the rate hiking cycle.
AUD/USD Daily Chart
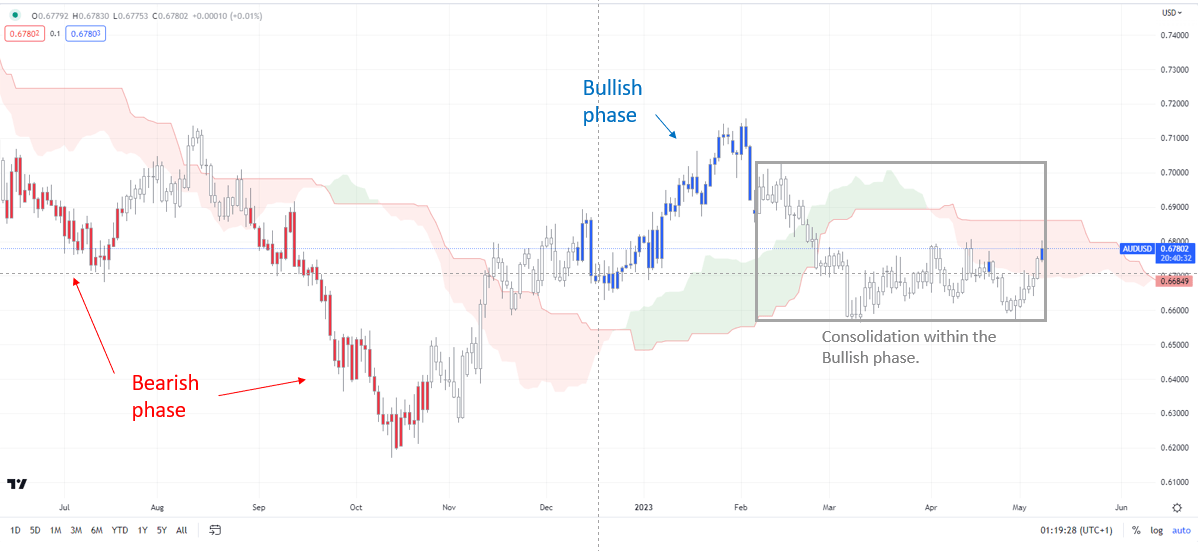
Chart Created by Manish Jaradi Using TradingView
Note: In the above colour-coded chart, Blue candles represent a Bullish phase. Red candles represent a Bearish phase. Grey candles serve as Consolidation phases (within a Bullish or a Bearish phase), but sometimes they tend to form at the end of a trend. Note: Candle colors are not predictive – they merely state what the current trend is. Indeed, the candle color can change in the next bar. False patterns can occur around the 200-period moving average, or around a support/resistance and/or in sideways/choppy market. The author does not guarantee the accuracy of the information. Past performance is not indicative of future performance. Users of the information do so at their own risk.
Australia’s Treasurer Jim Chalmers will unveil the annual budget for FY23-24 later today (7.30 pm AEST), which is expected to deliver the first surplus in 15 years. At the margin, a surplus is positive for AUD given its US counterpart runs a deficit. However, for it to have a sustainable impact on AUD, the surplus would need to turn into a trend, rather than a one-off case.
To be sure, while conditions are getting ripe for a meaningful rebound in AUD/USD, it may be too soon to call an end to AUD’s global decline, especially against EUR and GBP. See “Australian Dollar Price Setup: EUR/AUD, GBP/AUD, AUD/JPY”,published May 3.
AUD/USD Daily Chart
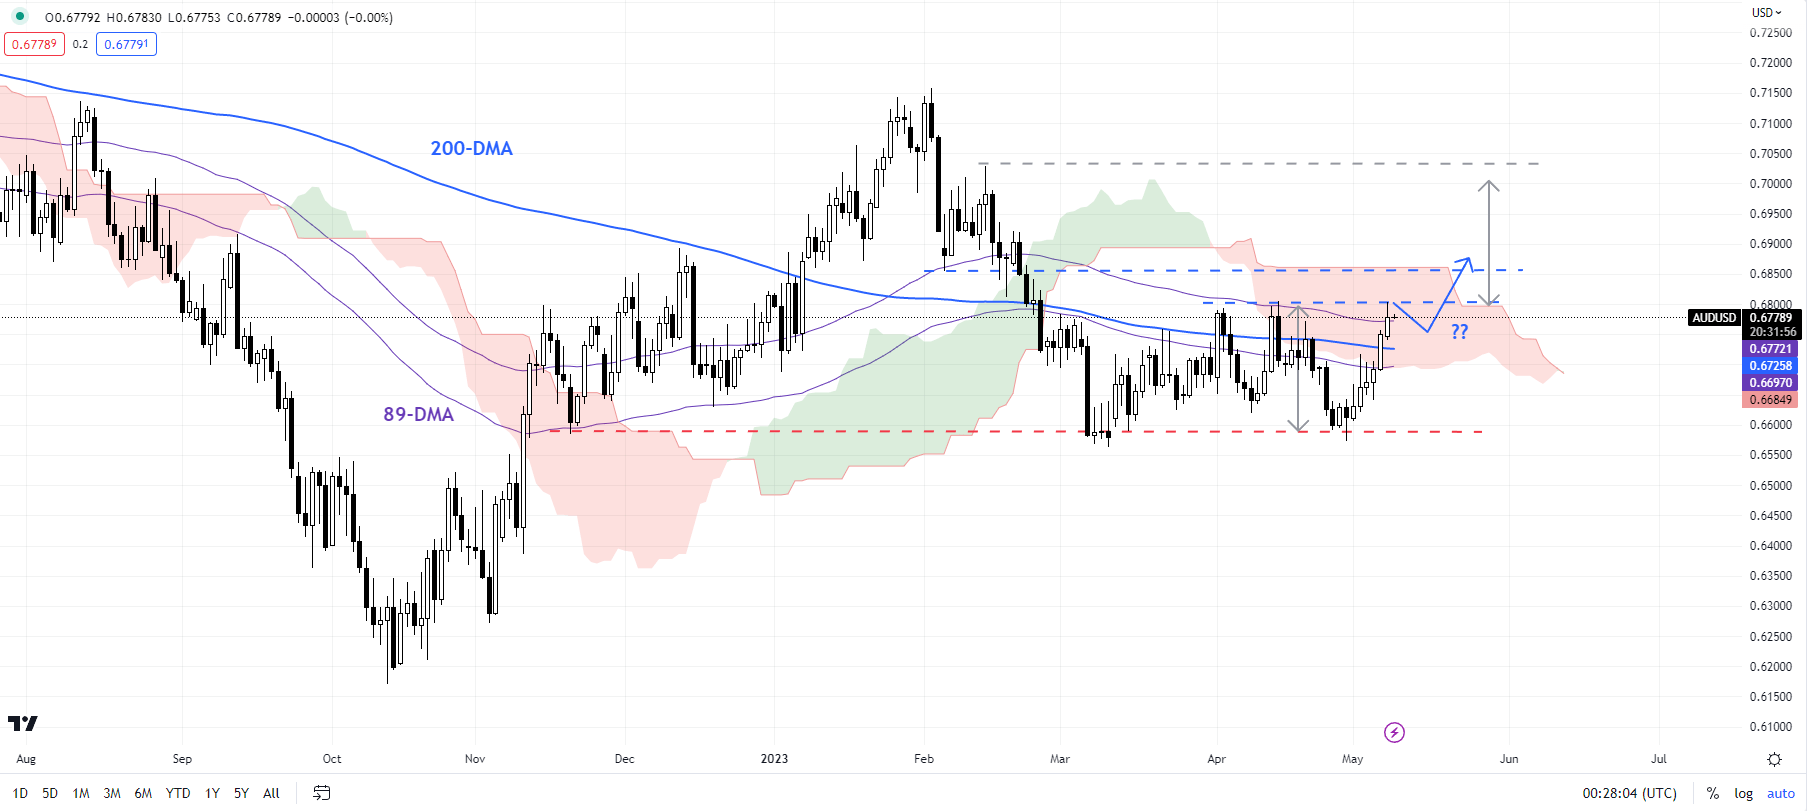
Chart Created by Manish Jaradi Using TradingView
AUD/USD: Testing key resistance
As the colour-coded candlestick charts based on trending/momentum indicators show, the setback since the start of the year is consolidation within the uptrend since October, and not the start of a downtrend (see colour-coded candlestick charts based on trending/momentum indicators). AUD/USD held crucial support on a horizontal trendline from November at about 0.6585. The subsequent “V”-shaped rebound gives an impression that the pair could be gearing up for a break above the immediate ceiling at the mid-April high of 0.6805. Such a break could open the door toward the mid-February high of 0.7025.
EUR/AUD Daily Chart
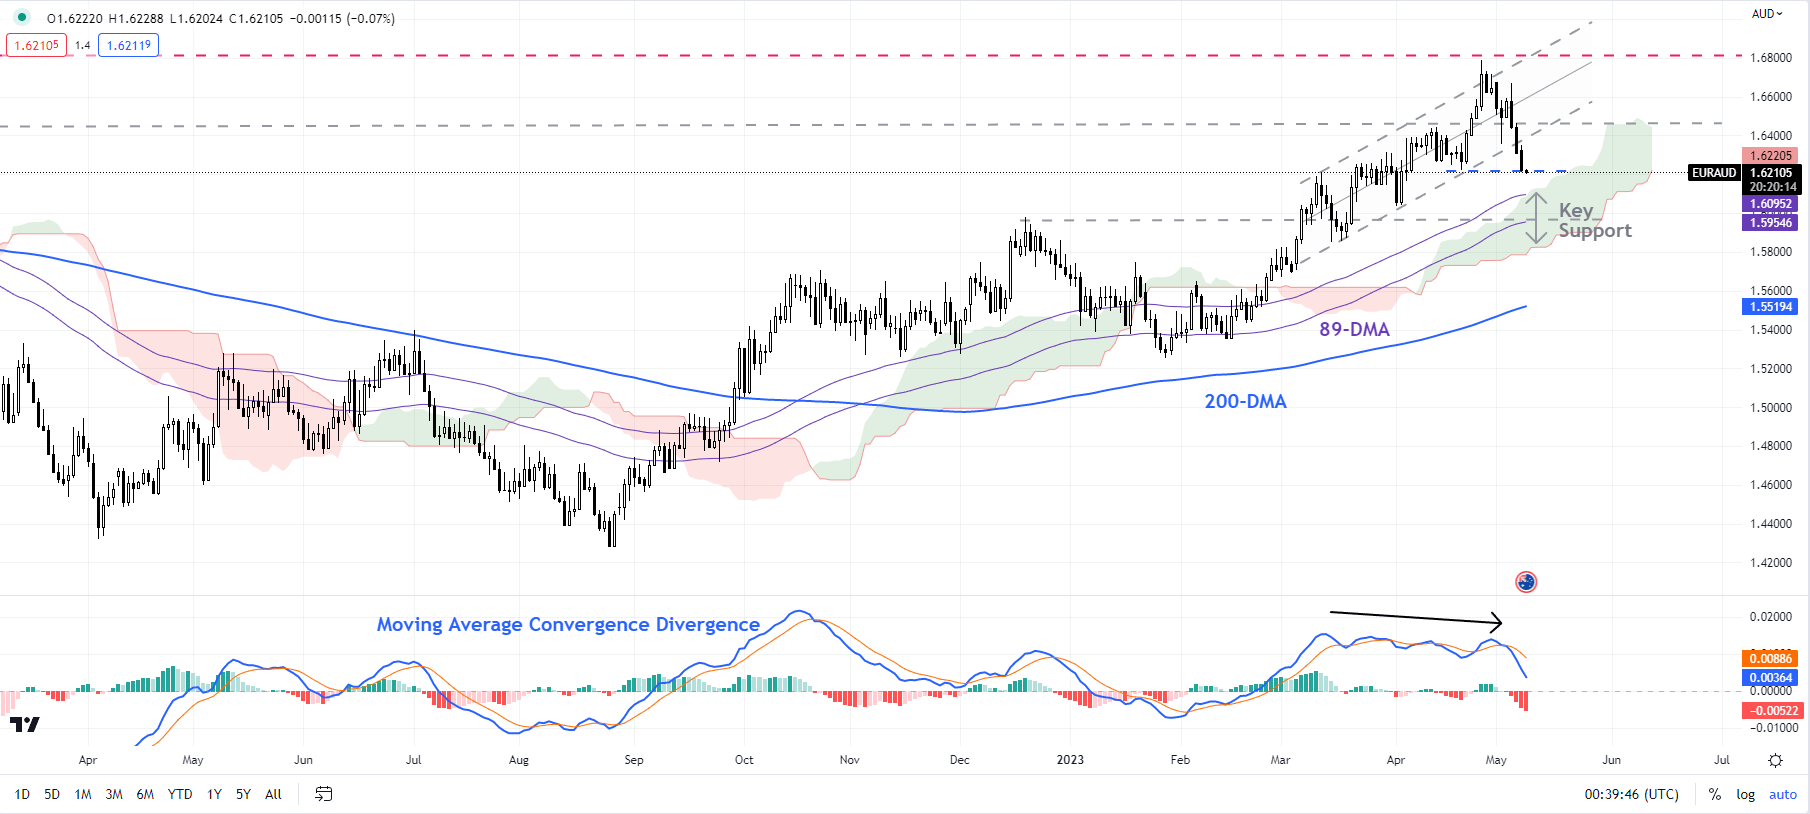
Chart Created by Manish Jaradi Using TradingView
EUR/AUD: Cracks in the rally?
EUR/AUD’s recent sharp retreat could be a sign that the multi-week rally is breaking down. However, unless the cross falls below immediate support at the late-April low of 1.6360, the path of least resistance could be sideways to up. For the multi-week upward pressure to fade, EUR/AUD would need to fall below 1.5950-1.6000 (including the December high and the 89-day moving average). EUR/AUD hit a 2.5-year high in April before succumbing to a stiff barrier at the October 2020 high of 1.6825.
AUD/JPY Daily Chart
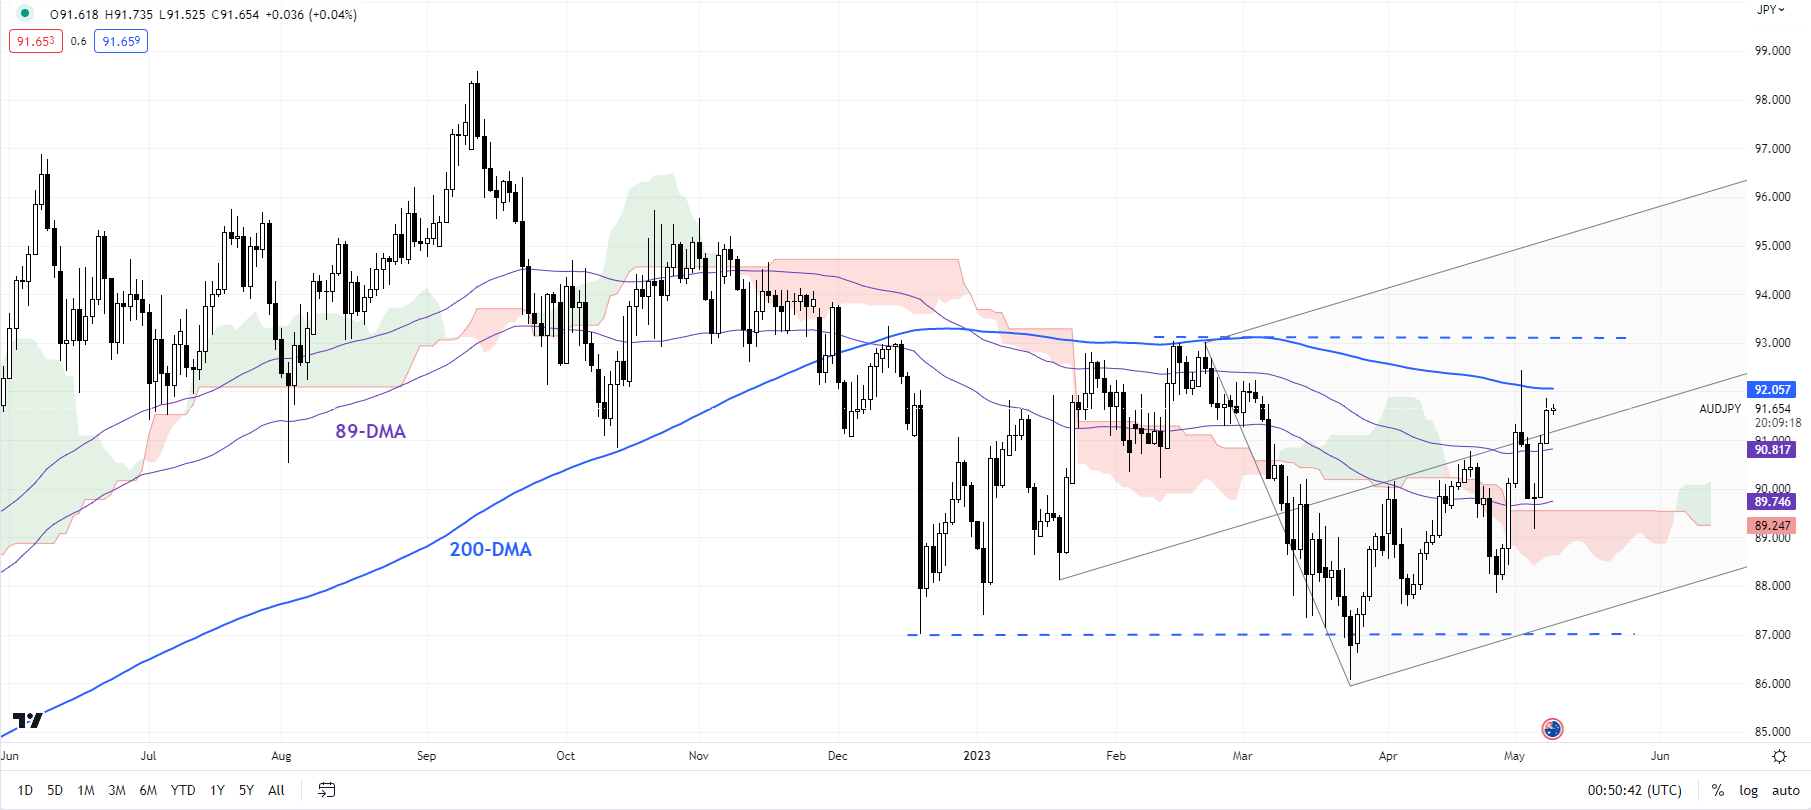
Chart Created by Manish Jaradi Using TradingView
AUD/JPY: Testing the top end of the range
AUD/JPY’s failure in March to break below a crucial support at the December low of 87.10 suggests the September 2022-March 2023 decline is corrective – AUD/JPY also held a fairly strong cushion on the 89-week moving average, coinciding with the October 2021 high. Still, the cross needs to clear the immediate hurdle on the 200-day moving average, coinciding with the mid-December high of 93.35 for the downward pressure to fade. In the absence of the resistance break, the broader range of 86.00-93.00 could continue.
Trade Smarter - Sign up for the DailyFX Newsletter
Receive timely and compelling market commentary from the DailyFX team
--- Written by Manish Jaradi, Strategist for DailyFX.com
--- Contact and follow Jaradi on Twitter: @JaradiManish


