


Australian Dollar Vs US dollar, Japanese Yen, Euro, British Pound – Price Setups:
- AUD is beginning to look oversold against some of its peers.
- EUR/AUD and GBP/AUD are approaching strong hurdles.
- Downward momentum in AUD/JPY is slowing at it nears strong cushion.
- AUD/USD has so far lagged its peers.

As the dust from the CPI data settles, the Australian dollar is beginning to look oversold as it approaches crucial support against some of its peers. While this wouldn't necessarily imply a reversal of the downtrend, it could be enough to trigger at least a short-term pause.
AUD suffered losses across the board on Wednesday after Australian inflation eased in the first quarter. The reaction to the CPI data suggests the market is choosing to focus on the inflationtrend, rather than thepaceof the cool-down. For more discussion see “Australian Dollar Off Lows After CPI: What’s Next for AUD/USD?”, published April 26.
Australia’s CPI rose to 7% on-year in the January-March quarter, Vs 6.9% expected from 7.8% in the previous quarter. However, inflation eased last month to 6.3% on-year Vs 6.5% expected, down from 6.8% in February. While inflation is still running above the central bank’s target band of 2%-3%, there is evidence that the rise is slowing. Whether the cool-down in inflation would be enough to prompt a pause at RBA’s May meeting is a close call.
The Australian central bank left interest rates unchanged at its meeting in early April saying it wanted additional time to assess the spillover of previous rate hikes on the broader economy but left the door open for additional tightening. “It was important to be clear that monetary policy may need to be tightened at subsequent meetings”, said the minutes of the RBA April 4 meeting. The market is pricing in the RBA Cash Rate at 3.64% by August (Vs 3.6% now), up from 3.72% just before Wednesday’s CPI data.
Meanwhile, AUD’s slide is beginning to look stretched in the near term, according to technical charts.
EUR/AUD Weekly Chart
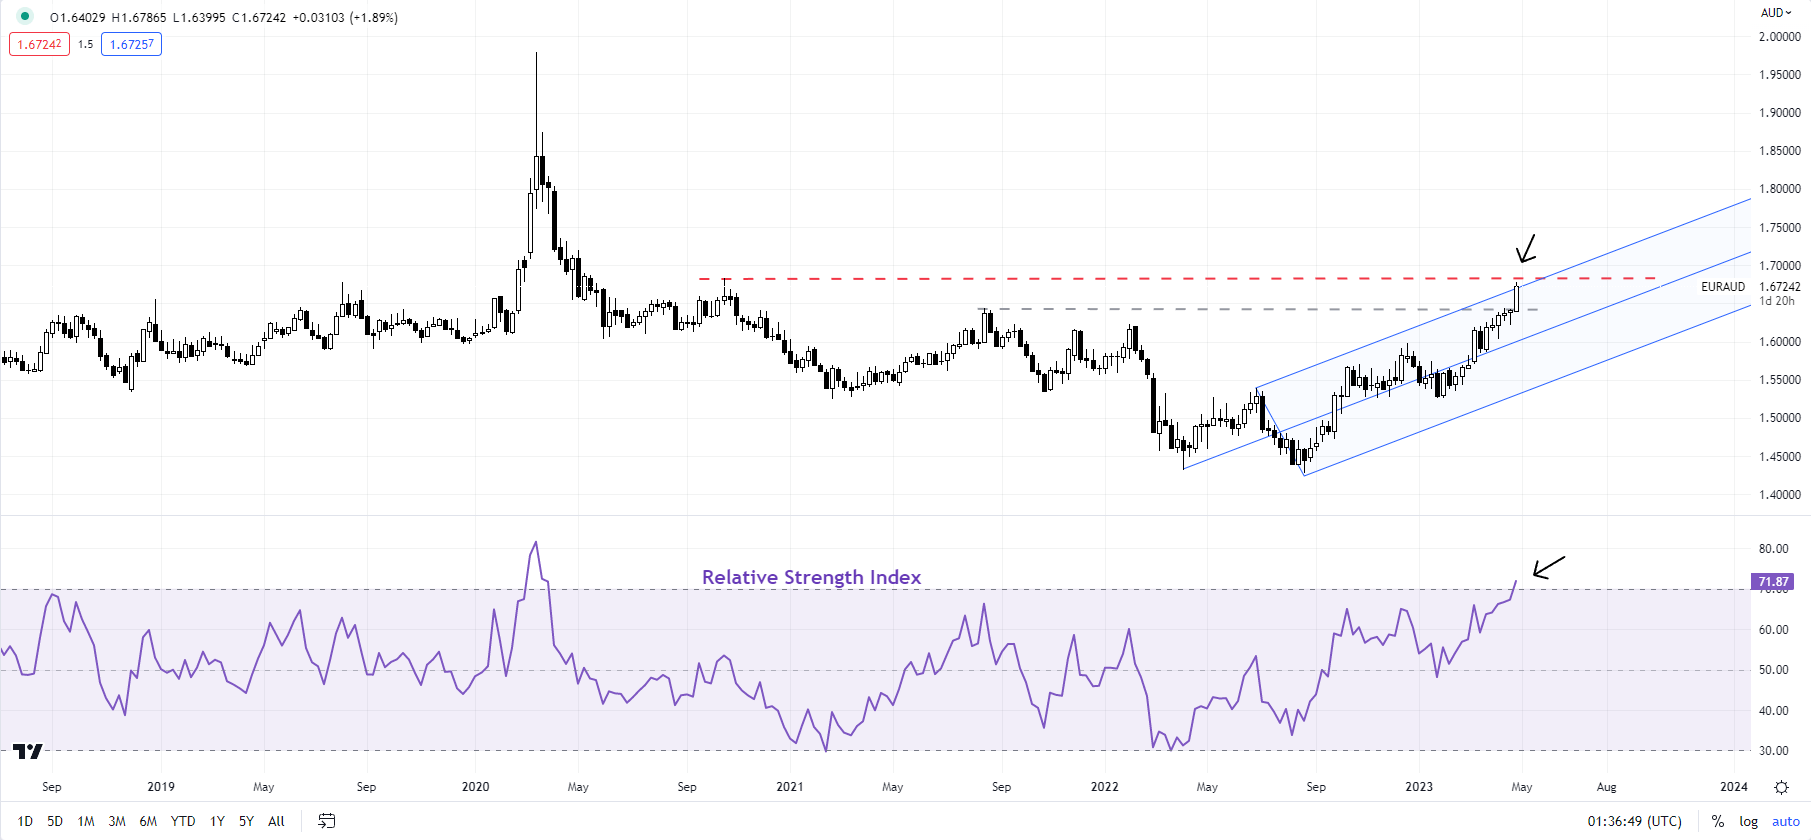
Chart Created Using TradingView
EUR/AUD – Roadblock ahead
EUR/AUD is approaching quite a stiff barrier at the October 2020 high of 1.6825, roughly coinciding with the upper edge of a rising channel from mid-2022. The 14-week Relative Strength Index (RSI) is now in overbought territory, raising the chances of at least some consolidation given the pace and the extent of the rise since the start of 2023.
GBP/AUD Weekly Chart
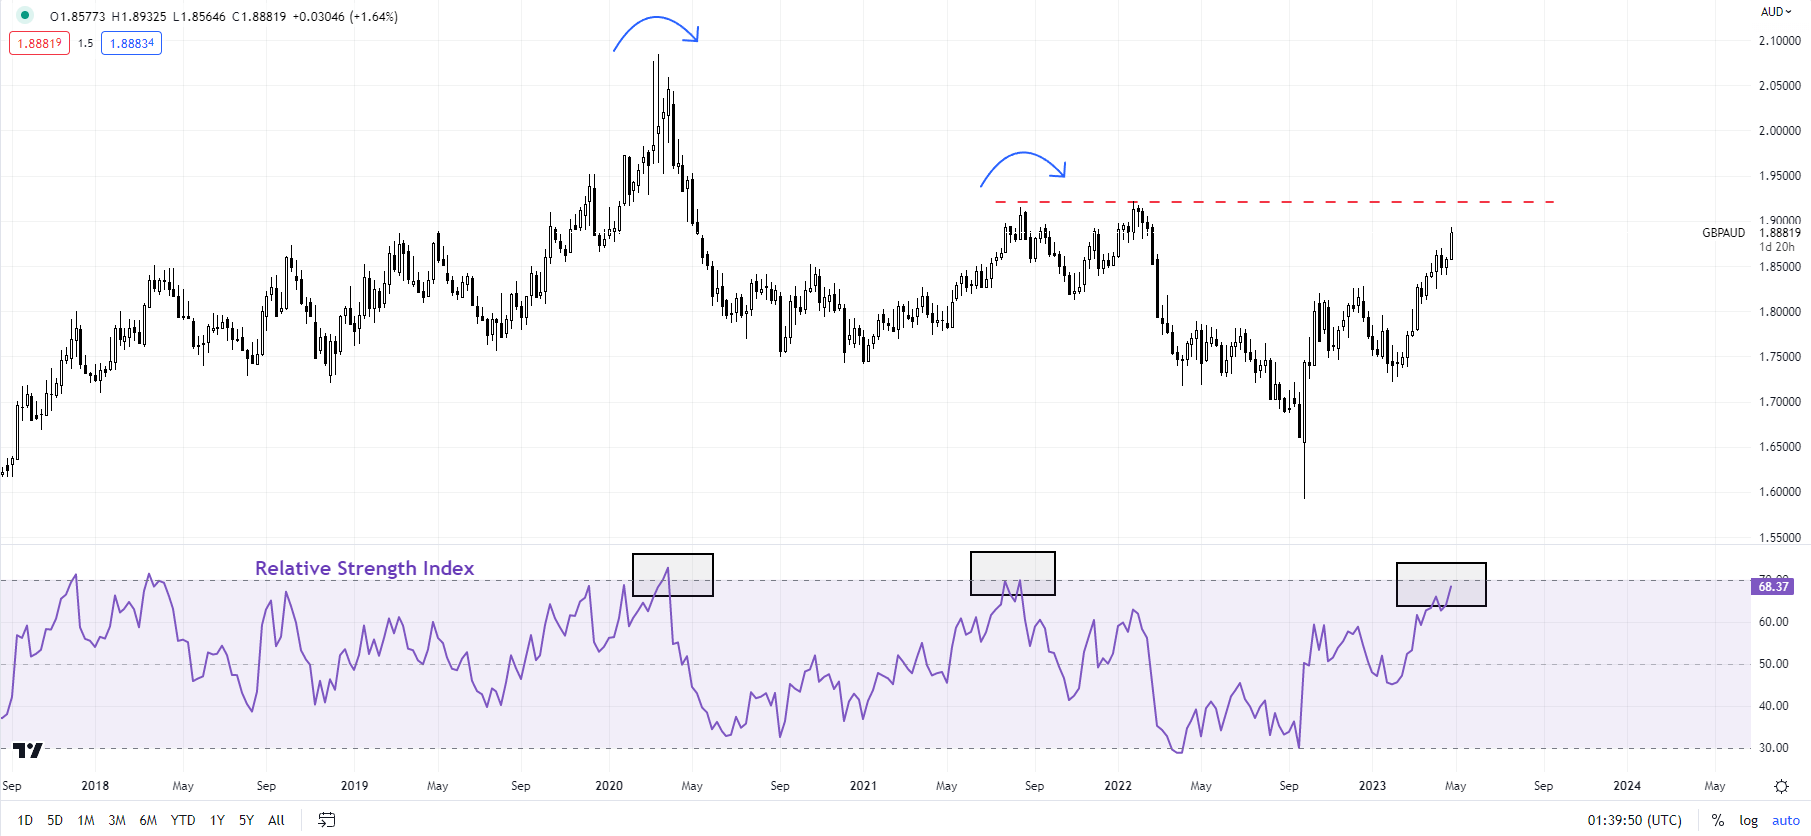
Chart Created Using TradingView
GBP/AUD: Overbought conditions emerging
GBP/AUD is looking equally overbought – the 14-week RSI is nearing the key 70-mark. Previous instances of RSI around 70 have been associated with a turnaround in GBP/AUD. This is especially important now as the cross is nearing a tough hurdle on a horizontal trendline from 2021, at about 1.9150.
AUD/JPY Weekly Chart
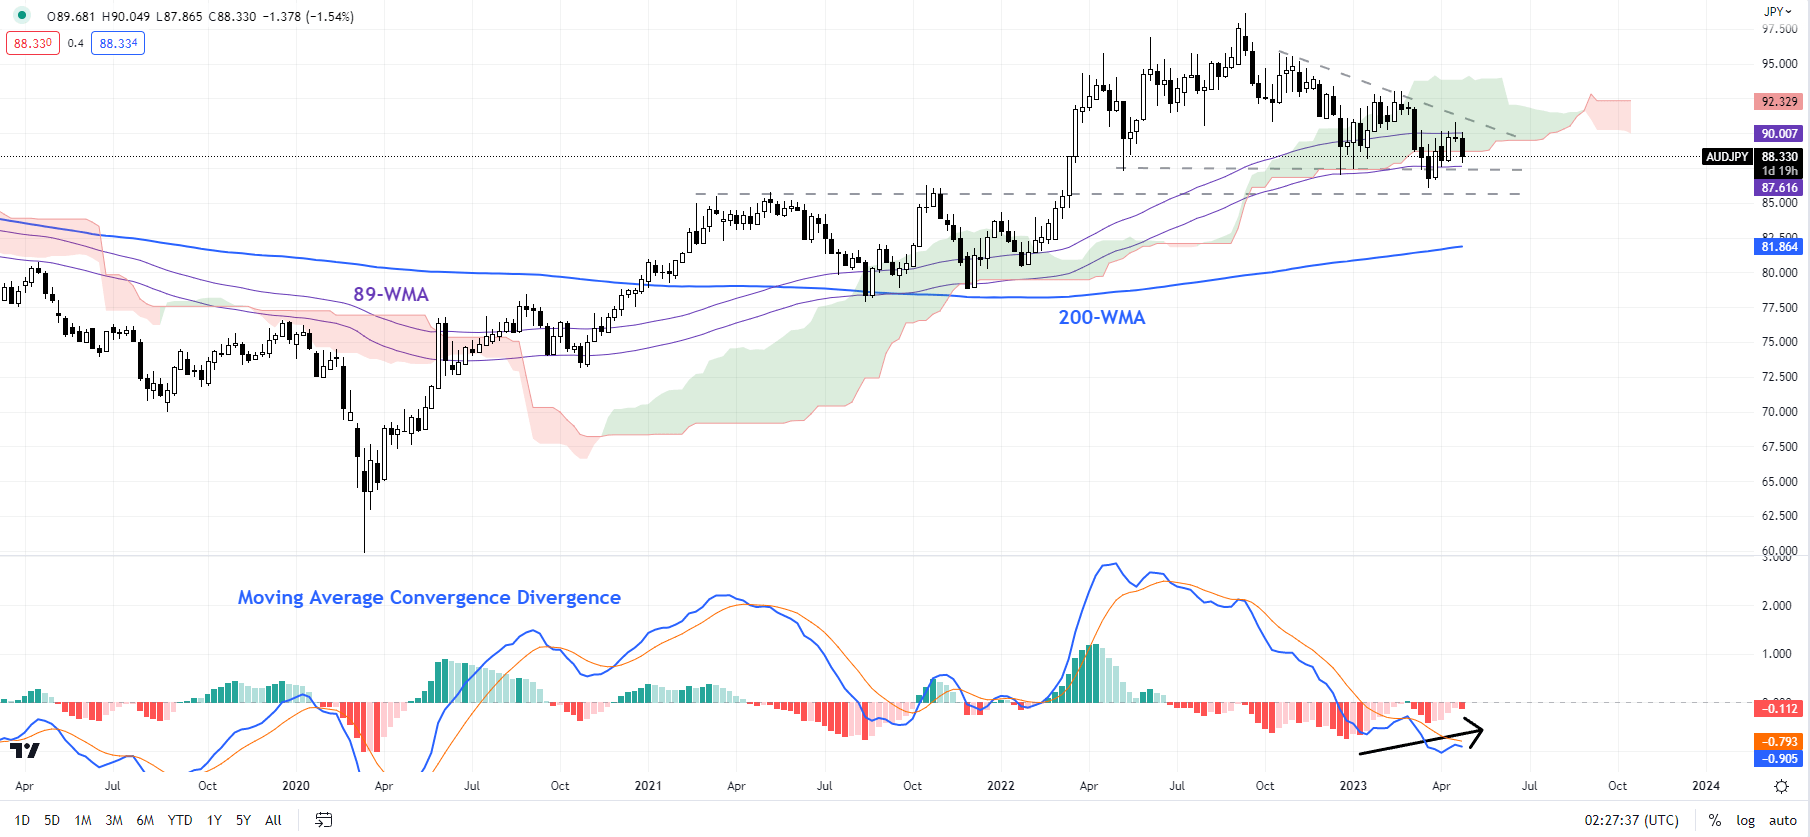
Chart Created Using TradingView
AUD/JPY: Downward momentum is slowing
AUD/JPY remains in a bearish mode since last year, but the downtrend is losing steam. Momentum is clearly slowing as AUD/JPY has made new lows – see the weekly chart with the Moving Average Convergence Divergence indicator. However, AUD/JPY has quite a strong converged cushion which could be tough to crack at least in the first attempt. This includes the lower edge of the Ichimoku cloud on the weekly chart, the 89-week moving average, and a horizontal trendline from 2021 at about 85.75.
AUD/USD Daily Chart
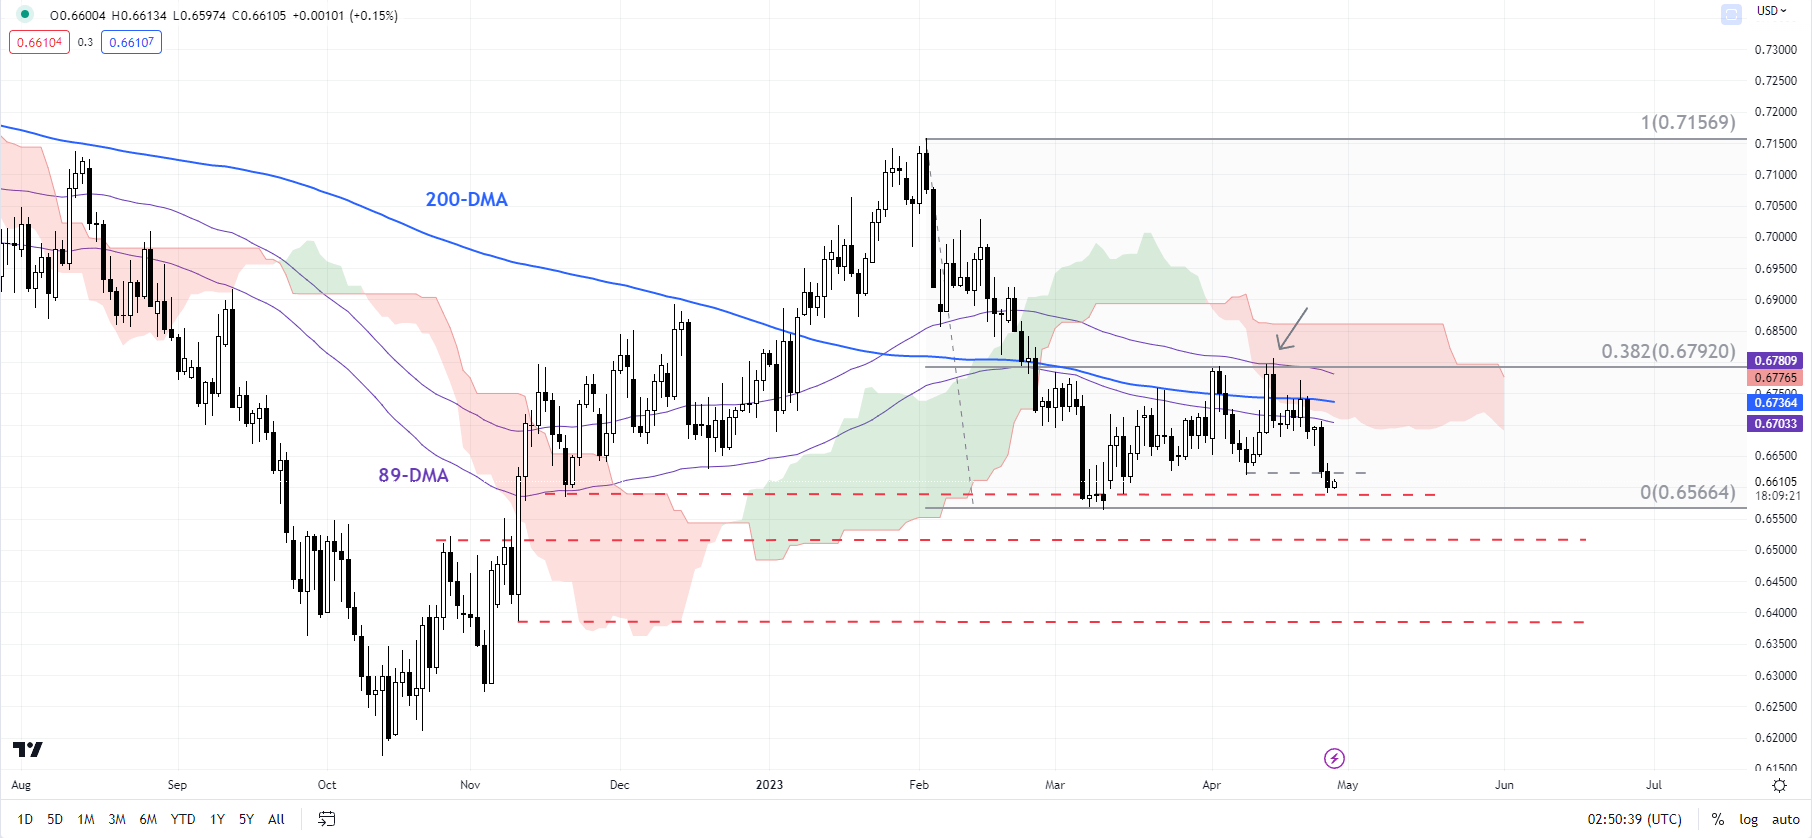
Chart Created Using TradingView
AUD/USD: No respite yet
AUD/USD's decline has been relatively muted recently. The rebound in March/April was feeble, eventually stalling at the 38.2% retracement of the February-March decline. AUD/USD is now testing a crucial floor on a horizontal trendline from the end of 2022 at about 0.6575. Any break below could pave the way toward 0.6520 followed by 0.6385, roughly the target of the minor double-top pattern (the April highs).
Trade Smarter - Sign up for the DailyFX Newsletter
Receive timely and compelling market commentary from the DailyFX team
--- Written by Manish Jaradi, Strategist for DailyFX.com
--- Contact and follow Jaradi on Twitter: @JaradiManish


