


Gold and Silver Weekly Technical Forecast: Neutral
- Gold prices trade flat after rising above 1800.
- Silver extends gains as bulls’ eye 24.00
- USD remains suppressed in anticipation of FOMC and major event risk

Gold Trades Cautiously While Silver Bulls March On
Gold and silver have been trading higher over recent weeks as the US Dollar surrenders a portion of its recent gains.
With XAU/USD currently trading above the key psychological level of 1800, this week’s price action remained subdued. As fundamental intensity eased and technical levels took centerstage, gold prices failed to gain traction, ending the week flat.
While the formation of a doji candle on the weekly chart forms around the 50-week MA (moving average) at 1807, next week’s event risk could drive the short-term move.
As central banks remain focused on taming inflation through restrictive monetary tightening, higher interest rates have been priced in leaving recession risks at the forefront of risk appetite.
XAU/USD Weekly Chart
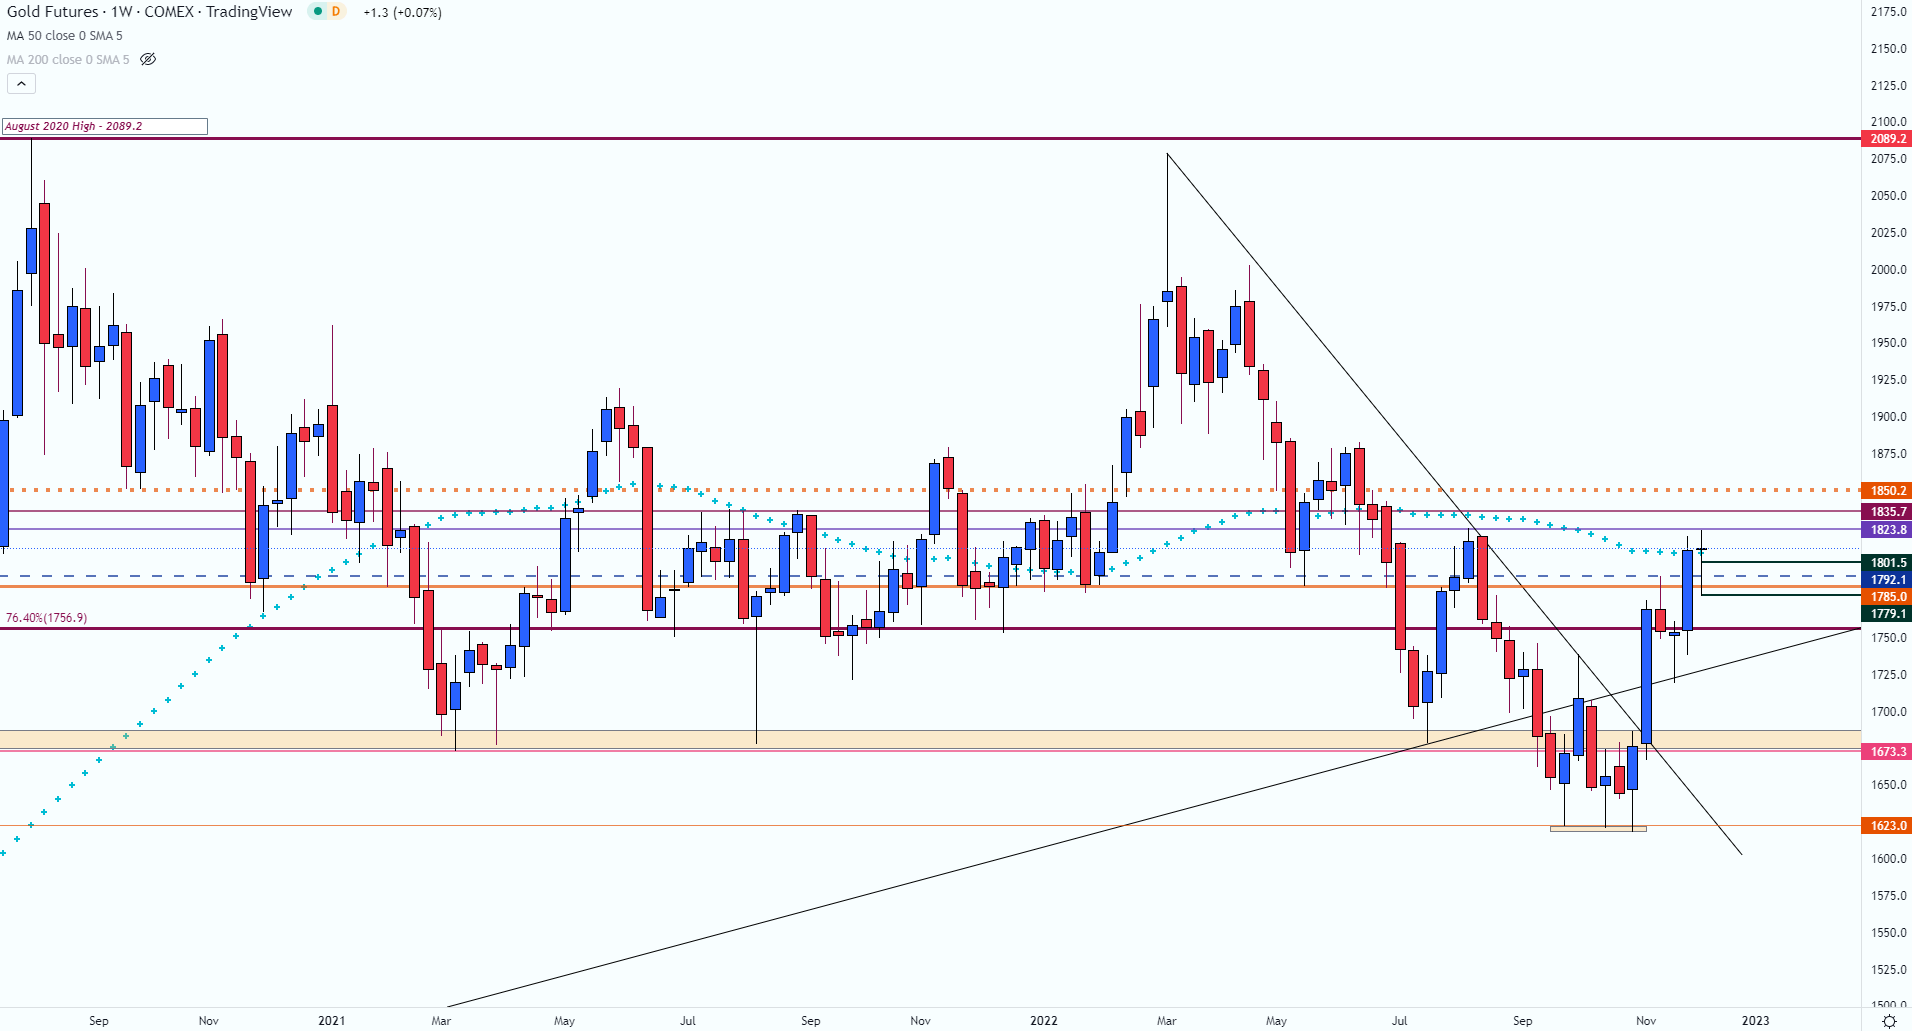
Chart prepared by Tammy Da Costa using TradingView
Gold (XAU/USD) Technical Analysis
After rising to a high of 2078.8 in March, the Federal Reserve announced its first 75 basis point rate hike, supporting Dollar strength. With the hawkish narrative triggering a seven-month decline, XAU/USD fell into a tight zone of support between 1623 – 1618.
As this range helped cap the September – November lows, a rejection of the candlewicks highlights the importance of this zone. However, with the resurgence of bullish momentum driving price action above prior trendline resistance, prices continued to climb before peaking at 1823.8.
XAU/USD Daily Chart
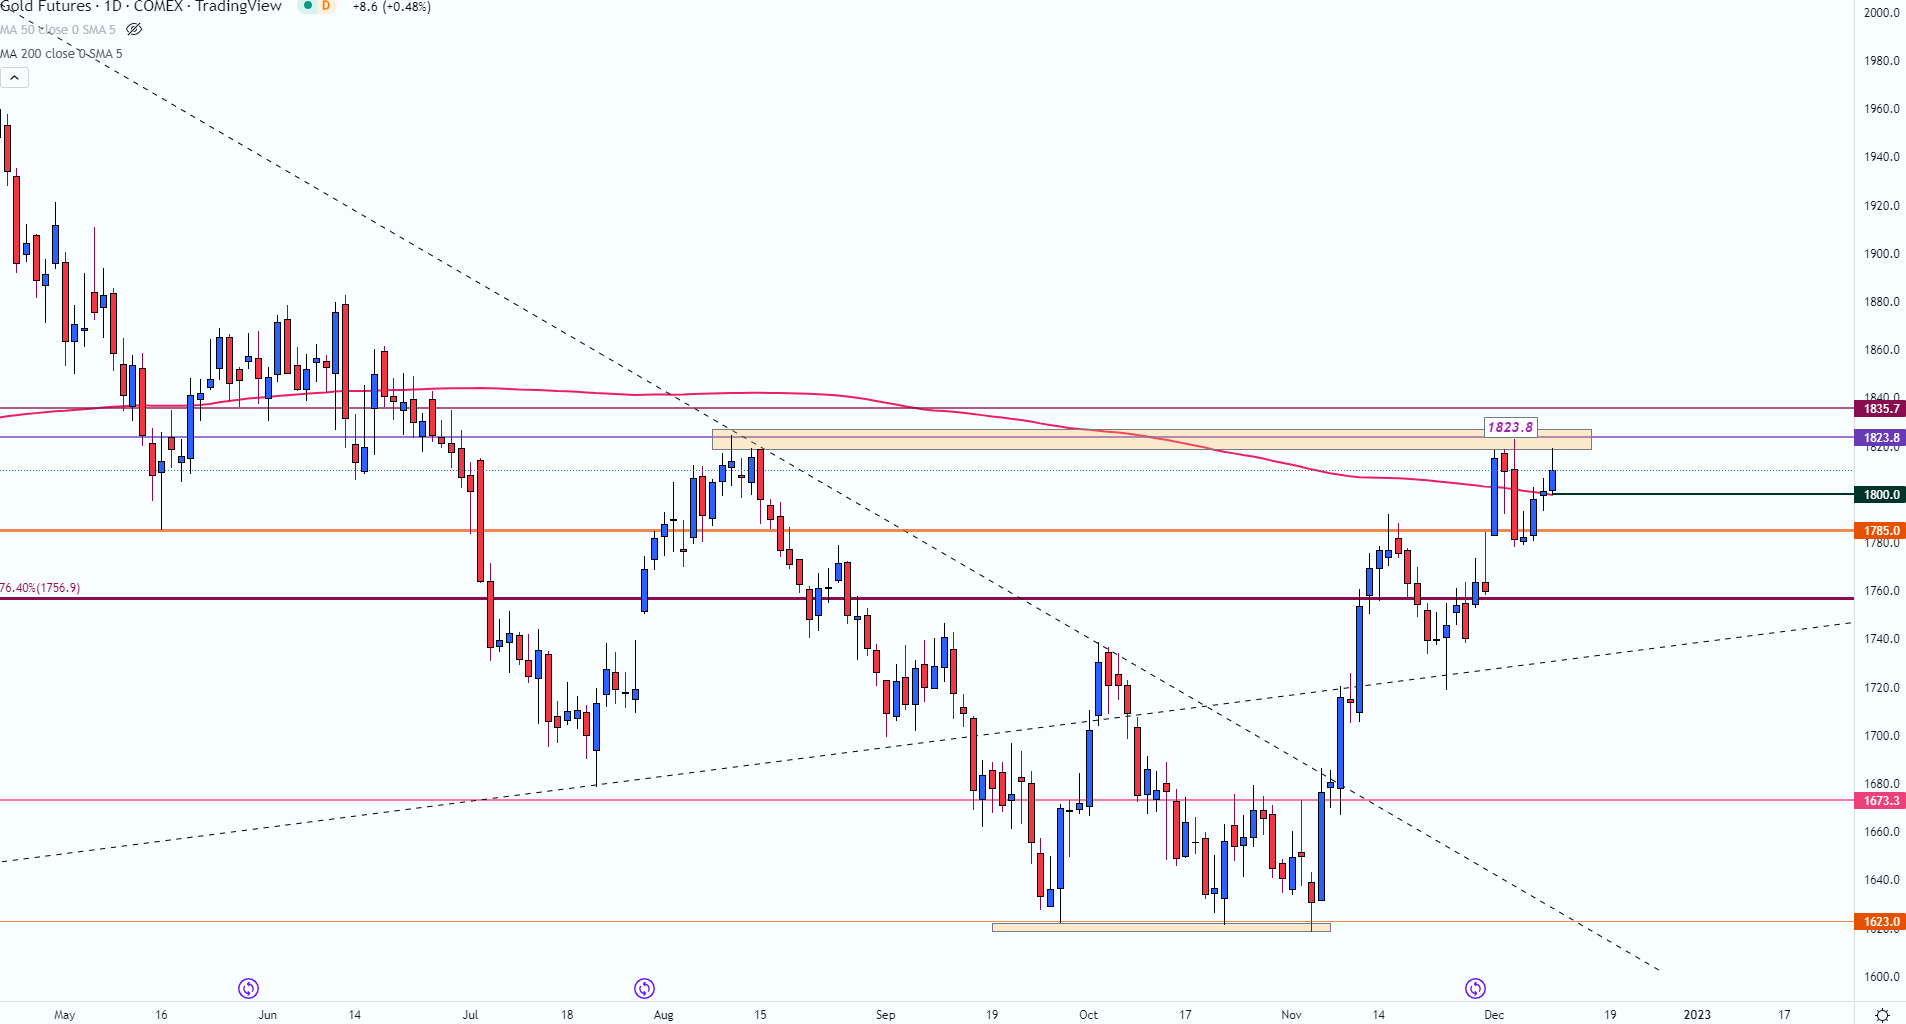
Chart prepared by Tammy Da Costa using TradingView
With body of the daily candle resting above 1800, this level coincides with the 200-day MA (moving average). As investors prepare for another FOMC, BoE (Bank of England) and ECB (European Central Bank) rate decision, inflation and sentiment data could fuel a move in either direction.
If recession fears ease and the Dollar gains ground, XAU/USD could fall below 1800 while the weekly low provides additional support around 1780. An increase in bearish momentum below this level could pave the way for a retest of 1760 and a move towards trendline support around 1720.
| Change in | Longs | Shorts | OI |
| Daily | 1% | -3% | -1% |
| Weekly | 2% | -8% | -2% |
Silver (XAG/USD) Technical Analysis
As Silver prices aim to break through Fibonacci resistance of the 2021 – 2022 move at 23.635, a hold above this level could drive XAG/USD back to the next big zone of resistance at 24.00 and towards 25.00. With the 23.00 and 22.00 psychological levels holding as support, a move lower could fuel bearish momentum back towards 21,25.
Silver (XAG/USD) Daily Chart
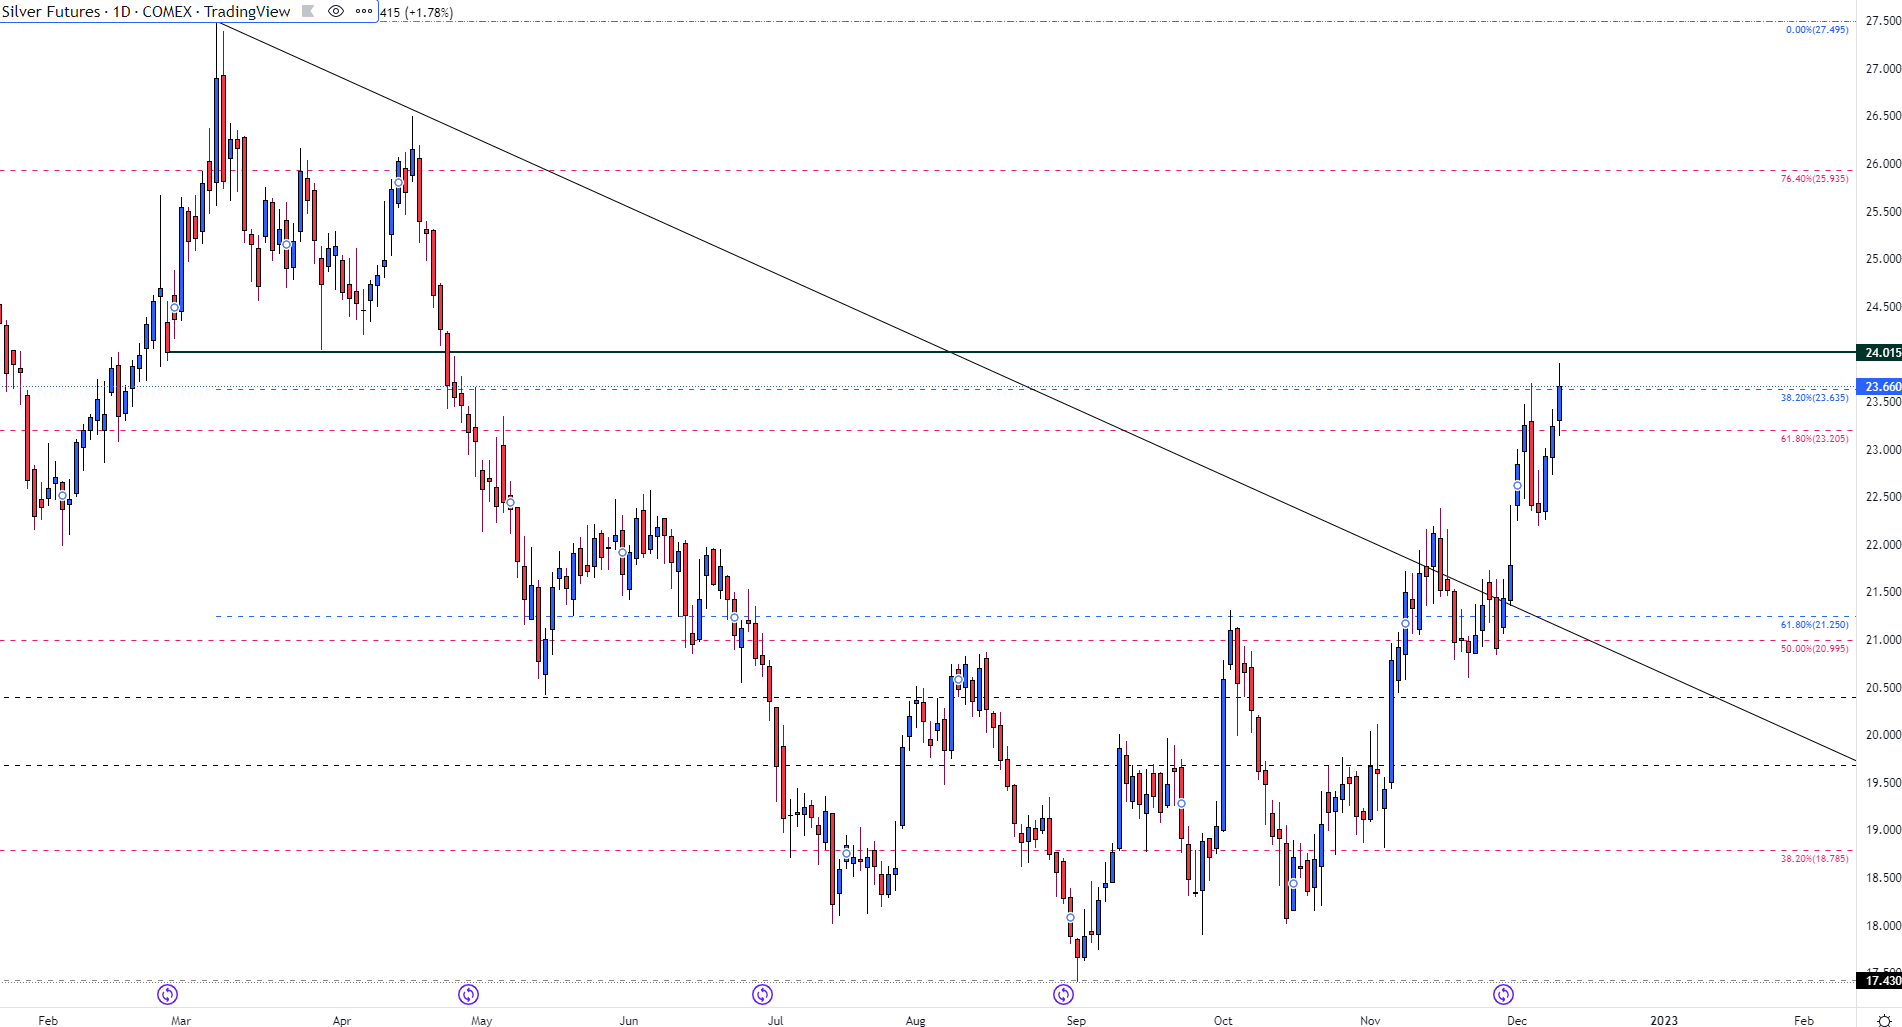
Chart prepared by Tammy Da Costa using TradingView
--- Written by Tammy Da Costa, Analyst for DailyFX.com
Contact and follow Tammy on Twitter: @Tams707


