GOLD PRICES FORECAST:
- Gold prices slide, pressured by soaring U.S. Treasury rates
- Nominal yields jump as strong U.S. economic data strengthens the case for additional monetary tightening
- U.S. jobs data on Friday could reinforce XAU/USD’s negative bias if employment growth surprises to the upside

Most Read: US Stocks Sink as Yields Soar, S&P 500 Carves Out Bearish Double-Top Pattern
Gold prices were subdued on Thursday and extended losses from the previous session, dragged lower by rising rates in the fixed-income space in both Europe and the U.S. following a hawkish repricing of central bank monetary policy.
In late afternoon trading, XAU/USD was down about 0.3% to $1,910 as U.S. yields staged a major rally, with the 2-year note blasting past 5.0% and the 10-year note pushing above 4.0%, the former reaching its highest level since 2007 and the latter matching its March peak in the wake of strong U.S. economic reports.
US YIELDS DAILY PERFOMANCE
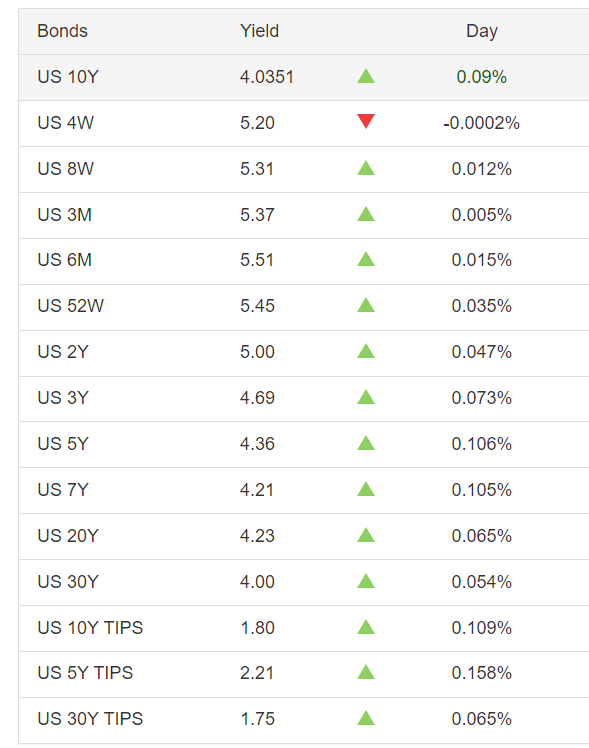
Source: TradingEconomics

According to payroll processing firm ADP, private sector headcount rose dramatically in June, leading U.S. businesses to add nearly half a million workers, more than double the median projection in a poll conducted by Bloomberg News.
Although the ADP survey tends to be poorly correlated with national employment data, it still provides valuable information about the labor market, which currently appears to be in excellent health and firing on all cylinders despite the increasingly restrictive monetary policy environment.
INCOMING US ECONOMIC DATA
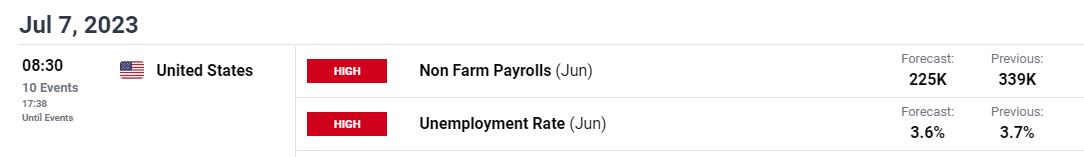
Source: DailyFX Economic Calendar
| Change in | Longs | Shorts | OI |
| Daily | -1% | 2% | 0% |
| Weekly | 9% | -5% | 3% |
We will get more clues about the broader hiring trend on Friday, when the U.S. government releases the June nonfarm payrolls (NFP) report. Estimates suggest the U.S. economy created 225,000 jobs last month, a result that’s seen bringing the unemployment rate down to 3.6% from 3.7% previously.
The Wall Street consensus has been underestimating job growth for 13 consecutive months, so it would not be surprising to see another hot and higher-than-forecast headline NFP print tomorrow. If this scenario plays out, rate expectations could continue to drift in a more hawkish direction, creating a hostile landscape for non-yielding assets, such as gold.
For the previously mentioned reasons, precious metals will remain vulnerable and biased to the downside for now, meaning further losses are likely in the coming days and weeks before some stabilization later in the summer.
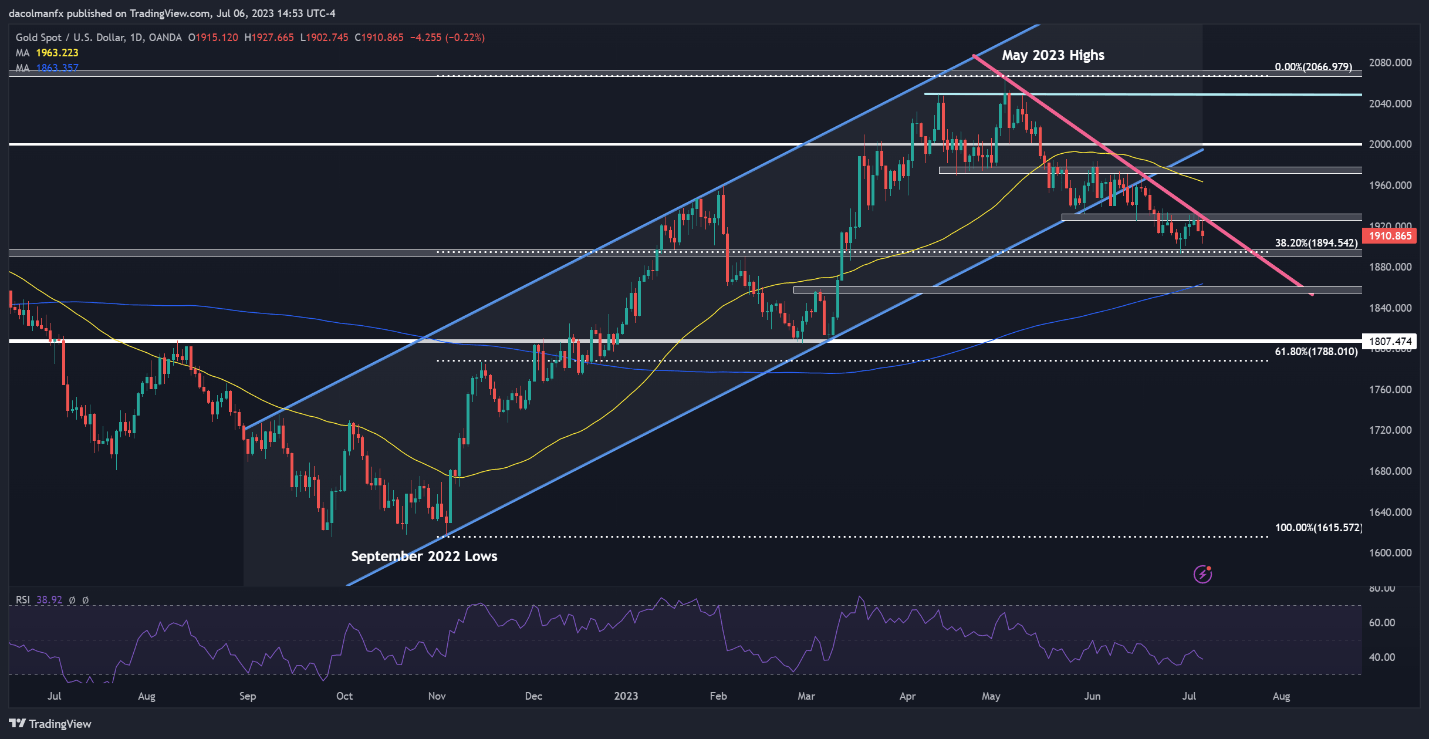
From a technical standpoint, gold turned lower after failing to clear trendline resistance at $1,935 earlier in the week. After that rejection, XAU/USD headed south quickly, with prices currently approaching Fibonacci support at $1,895, which represents the 38.2% retracement of the Sept 2022/May 2023 rally.
If $1,895 gets taken out, selling momentum could gather pace, setting the stage for a possible pullback toward the 200-day simple moving average hovering slightly above $1,860.
In the unlikely scenario bulls regain control of the market, initial resistance stretches from $1,930 to $1,935. On further strength, the focus shifts higher to $1,975.
GOLD PRICES TECHNICAL CHART