
S&P 500 OUTLOOK:
- S&P 500 falls as U.S. Treasury rates skyrocket following strong U.S. economic data
- Solid private sector payrolls and services sector activity data reinforce expectations for additional monetary tightening
- The S&P 500 appears to be carving out a double-top pattern. If confirmed, this technical formation could portend losses for the equity index

Most Read: Q3 Top Trade: S&P 500 Vulnerable to Pullback on Weak Fundamentals and Frothy Markets
U.S. stocks sold off on Thursday undercut by soaring U.S. yields, which moved sharply higher across the Treasury curve. The 2-year note, for instance, surged past 5.0% and briefly reached its highest level since 2007. Meanwhile, the 10-year bond broke above 4.0%, nearly matching the March high.
US YIELD CURVE
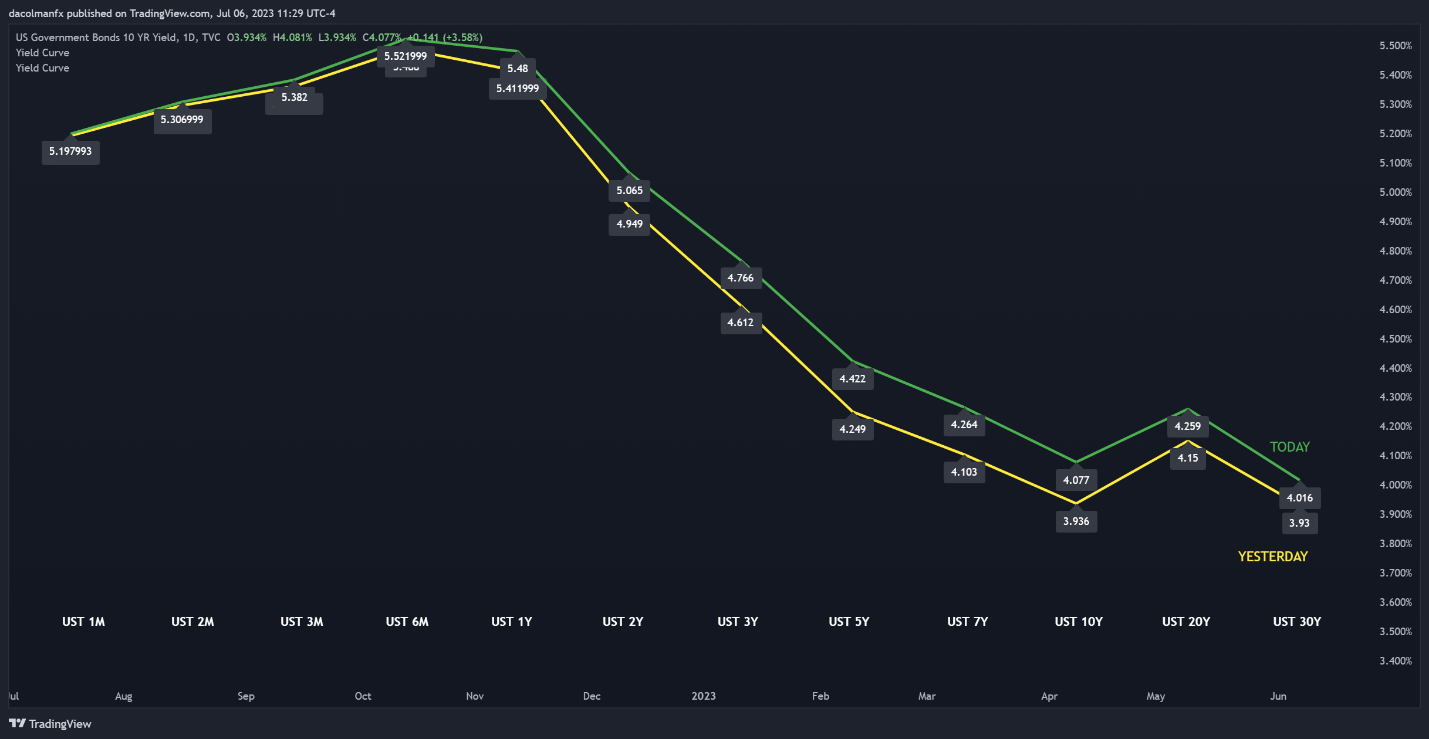
Source: TradingView
The move in rates was driven by strong U.S. economic numbers. Earlier in the session, the ADP report showed that private employers added 497,000 jobs last month, well above the forecast of 220,000 payrolls, a sign that the labor market remains extremely resilient and is still firing on all cylinders despite the Fed's aggressive stance.
The ISM services PMI results also surprised to the upside, defying the doom-and-gloom narrative so prevalent in the financial media. According to the survey, the non-manufacturing sector gauge climbed to 53.9 from 50.3 previously, beating consensus estimates of a more modest rebound to 51.00.

US ECONOMIC DATA AT A GLANCE
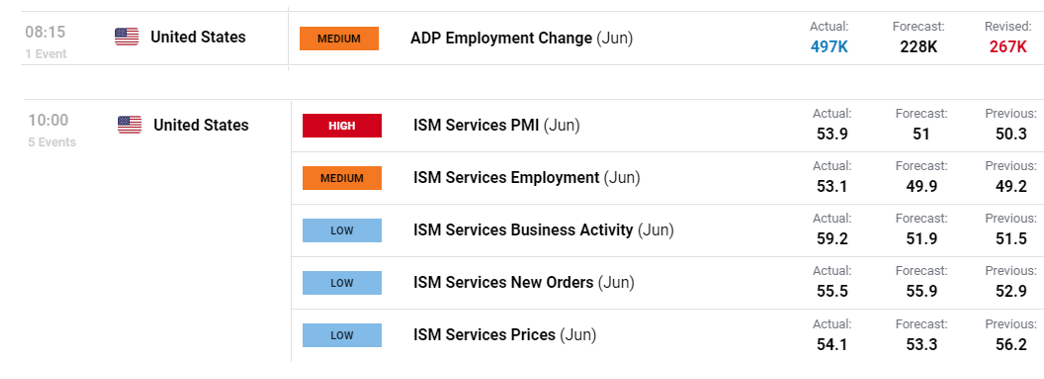
Source: DailyFX Economic Calendar
Taken together, the latest batch of data reinforced expectations for further monetary tightening, cementing bets of a quarter-point hike at the July FOMC meeting and increasing the likelihood of a similar move in September. Should this scenario play out, the upper bound of the Federal funds rate could peak at 5.75%, an unseen level since 2001.
The chart below shows how 2023 interest rates expectations have shifted in a more hawkish direction as reflected by Fed funds futures implied yields.

2023 FED FUNDS FUTURES IMPLIED YIELDS
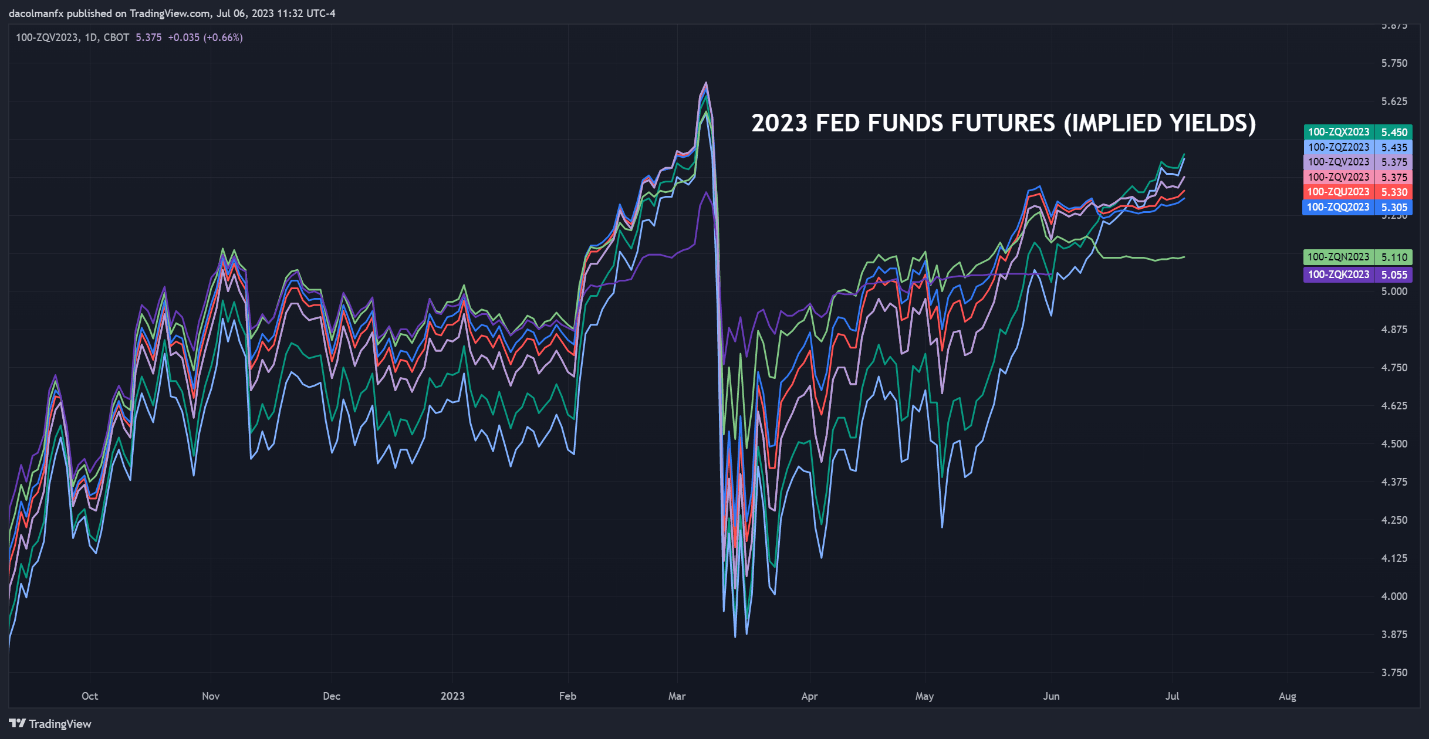
Source: TradingView
Against the current backdrop, S&P 500 futures contracts were down about 1.15% in early afternoon trading, retreating for the second day in a row after failing to clear overhead resistance at 4,500. With nominal and real yields charging upwards, equity valuations are becoming less and less attractive, so a larger pullback could be just around the corner.
At the same time, bond yields have reached and, in some cases, surpassed their first-quarter peak, when the banking sector crisis erupted. A similar episode could play out again shortly if rates remain elevated for too long. This may explain why banks are selling off across the board on Thursday.
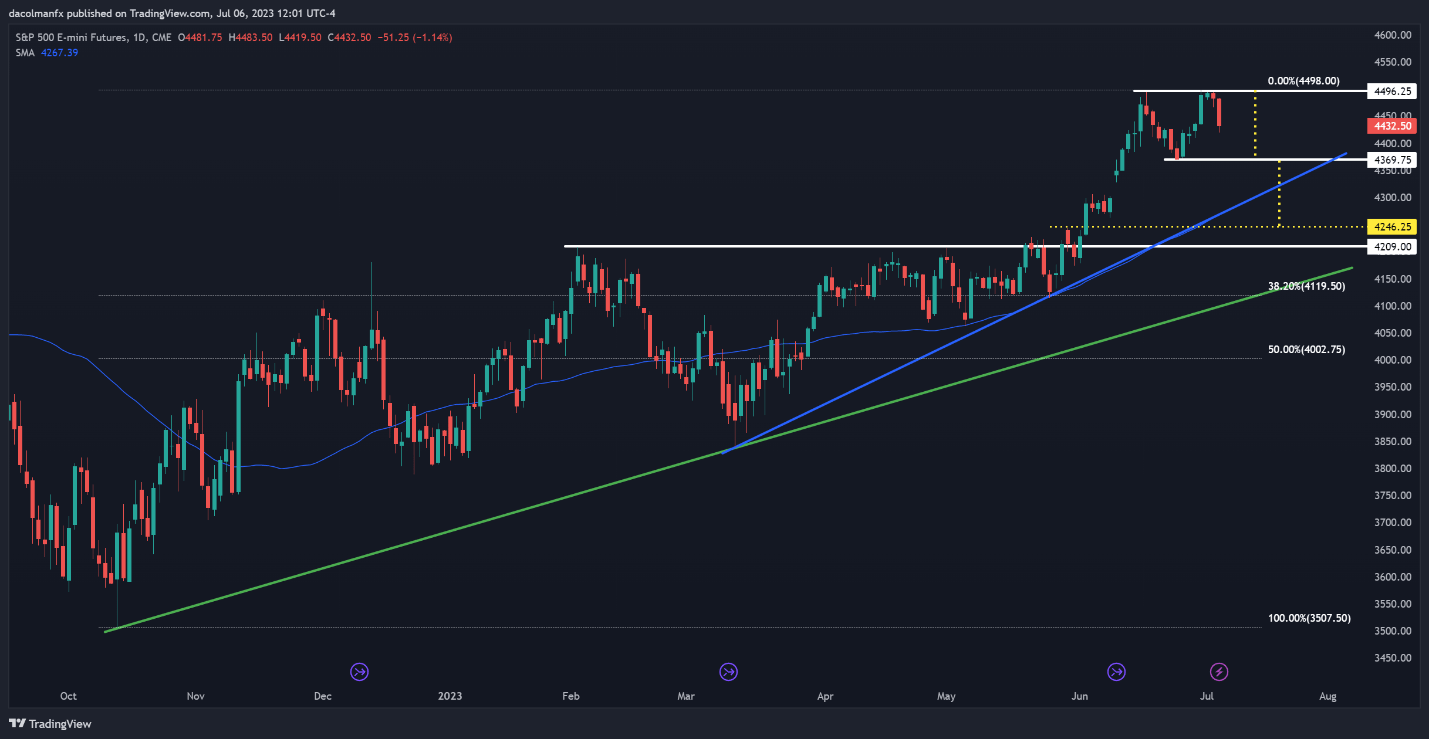
In terms of technical analysis, the S&P 500 appears to be forging a doble top as shown in the daily chart below. A double top is a reversal pattern composed of two similar peaks separated by a depression that frequently develops in the context of an extended move higher.
This bearish setup is confirmed once the price completes its “M” looking shape and breaks below its neckline, the technical support created by the formation’s intermediate trough.
In the case of the S&P 500, the neckline sits around 4,365. In this floor is taken out, sellers may become emboldened to launch an attack on 4,275, followed by 4,250. The latter level represents the potential size of a downward move predicted by the double top, which is obtained by projecting vertically the height of pattern from the break point.
| Change in | Longs | Shorts | OI |
| Daily | -3% | 0% | -1% |
| Weekly | -5% | -4% | -4% |
S&P 500 FUTURES TECHNICAL CHART