


S&P 500, VIX Volatility Index, Volume and Seasonality Talking Points:
- The Market Perspective: S&P 500 Range Between 4,100 and 3,600; Bearish S&P 500 Below 3,500
- The S&P 500 absorbed an approximate -20 percent loss in 2022, the worst year’s performance for the index since 2008
- While there are unresolved fundamental matters that continue to represent a burden to sentiment heading into 2023, there is also favorable analysis – such as seasonality norms

We have brought to a close the 2022 trading year and are now heading into 2023. As is often expected in the final bout of liquidity in most trading years, speculative appetite lost traction through the final weeks of December. From a purely statistical standpoint, the fourth quarter of 2023 registered a 6.1 percent recovery for the S&P 500 – which I use as a stand in for ‘risk trends’ – following three consecutive quarters of loss (the first such stretch since 2008). However, on the year, the same index ultimately lost -20 percent. That is the worst year since the Great Financial Crisis in 2008 and the third worst yearly performance for the benchmark in 48 years. In the past century, the S&P 500 has only lost ground on this time frame 30 out of the 100 years. There have only been four instances in that same time frame where the markets realized consecutive years in the read – the last being the 2000 to 2002 three-year and -40 percent slide. Excluding the Great Depression of the early 1930s, the year following a -20 percent or greater loss from the S&P 500 averaged a 21 percent gain.
Chart of S&P 500 on Logarithmic Scale with 1-Year Rate of Change (Yearly)
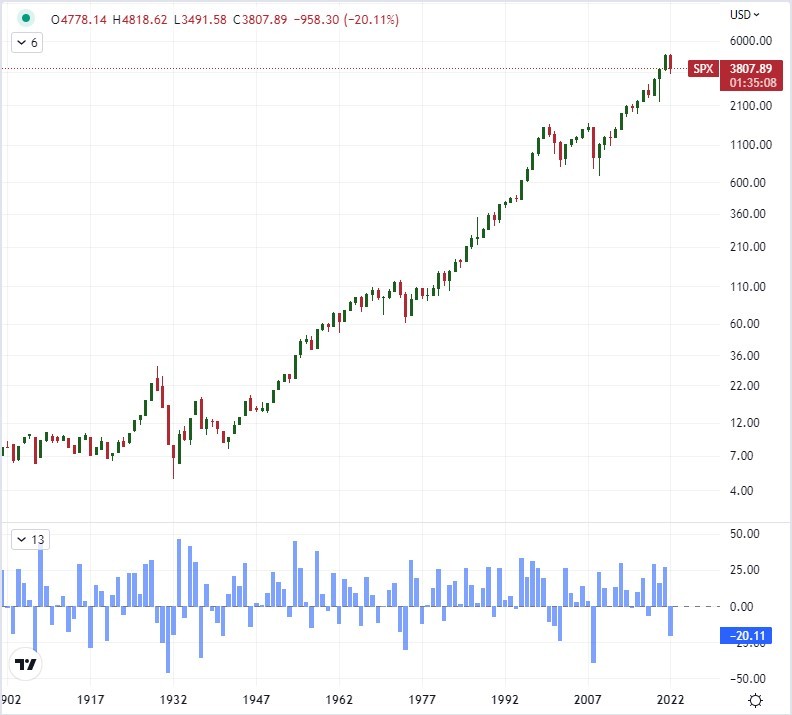
Chart Created on Tradingview Platform
Statistics can offer valuable insight, but such averages should not be construed as certainty of what lies ahead. Fundamental circumstances change over the span of weeks, months and years, cutting across the normal layout of a calendar. While back-to-back yearly losses are unusual historically, an extension of losses through a portion of the subsequent year is much more common. That is important to remember as we head into 2023 considering that some of the most important, prevailing fundamental themes of the previous year have not resolved in support of the bulls. Painful inflation, trade encumbrances, tighter financial conditions and recession concerns are among the top themes threatening continued pressure. As we move into the near year, developments will eventually nudge the scales on these prime themes; but in the absence of an overwhelming fundamental urge, traders and investors should keep in mind seasonal averages.
Chart of S&P 500 Emini Futures with Volume and Overlaid with VIX Volatility Index (Daily)
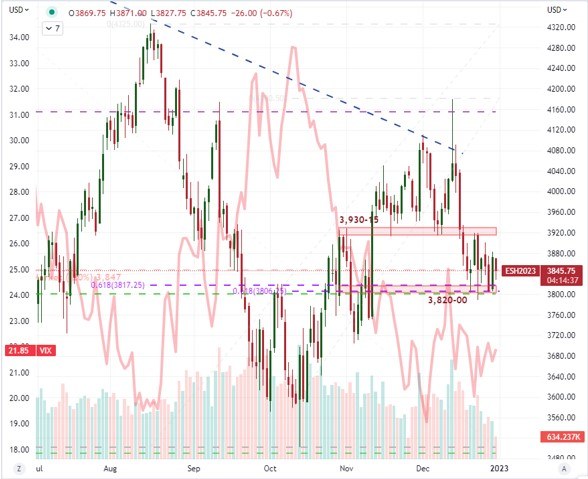
Chart Created on Tradingview Platform
Starting on a monthly basis, it’s important to gain a bigger picture of the market environment that we typically see at the start of the year. Historically, the month of January has averaged a 0.9 percent gain over the month, but the year-to-year performance can differ drastically. More useful to me when averaging out conditions is the volume and volatility typical of the time frame. Volume has increased modestly from December to January according to month-end comparisons, but averaging out the months according to daily levels, January is only modestly higher compared to the previous month. On a trading day adjusted basis, however, January is the second thinnest month of turnover of the calendar year. In comparison, volatility picks up to start the year. Assessing volatility as the average close of the VIX on a daily basis through the month, the ‘fear index’ has averaged 19.6 from 1990 to 2021. Activity on that measure accelerates into February and peaks for the year in March.
Chart of Average S&P 500 Performance, Volume and Volatility by Month from 1990 to Present (Monthly)
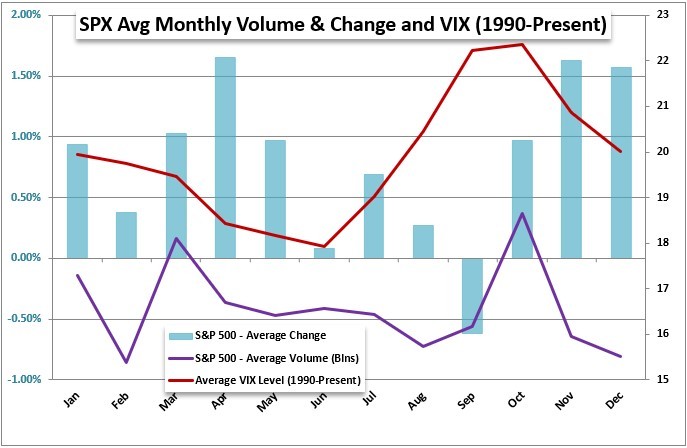
Chart Created by John Kicklighter
Relative to the year, January does not look particularly remarkable compared to the extremes of March or October volatility peaks, May volume doldrums or the November-December strongest bullish average. For just the month of January, I wanted to give context to how significantly performance has diverged from year to year. Among a surprising range of market participants, there is some level of expectation that how January pans out will inform the performance for the entire year. As it happens, from 1950 through this past year, the opening month’s direction matched the year end performance (both positive or both negative) 53 out of the 73 years in that spectrum. As for activity level, the range in January has oscillated significantly from very active to very quiet over the past 7 years.
Chart of S&P 500 Performance and Range for January 1950 through 2021 (Monthly)
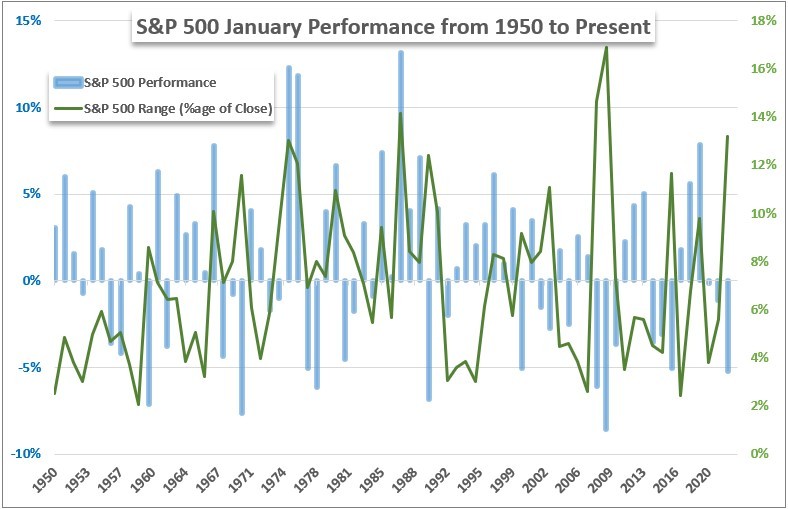
Chart Created by John Kicklighter
On a shorter basis, the opening week of the year averages some stronger readings. Breaking each year down into its 52 calendar weeks and averaging performance from 1900 up through 2021, the first week of the year averages the strongest performance of the entire year historically. Of course, that can different from year-to-year; but the reallocation of capital by funds at the beginning of each year is a fairly consistent influence. In the absence of a more pressing fundamental matter or strong sentiment wind, markets may be encouraged to default to seasonal norms.
Chart of S&P 500 Performance Per Week from 1900 to Present (Weekly)
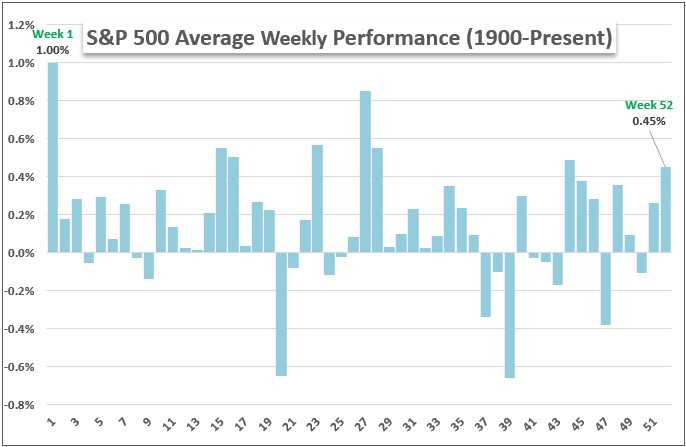
Chart Created by John Kicklighter
In contrast to performance, the measure of volume (which I use as a proxy for participation) through the opening week proffers a significantly deflated average. That has more to do with the fact that the month of January can actually start on different days of the week depending on the year. However, the holiday following the New Years (whether celebrated on the first of the month or first trading day after) does naturally reduce activity over the span of the entire week.
Chart of Average S&P 500 Weekly Volume from 1950 to Present (Weekly)
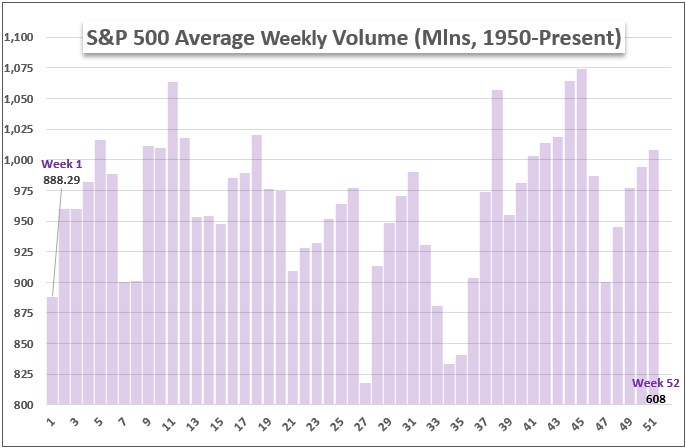
Chart Created by John Kicklighter
The foil to volume, volatility tends to increase from the final weeks of the preceding year to the open of the new one. Below, we see that the transition from 2021 to 2022 was significantly deflated, but it quickly escalated into the slide that ultimately drove us to the bear market we would register later in the year. The VIX was relatively deflated through December in comparison to average performance mapped out through the year, which may translate into a view that the markets are undercounting the potential for surprise and sharp market movement as liquidity is restored – that is further compounded by the extremely low readings of the VVIX (volatility of volatility index) and SKEW (tail risk index).
Chart of VIX Volatility Index with Average VIX Performance Per Week Since Inception (Weekly)
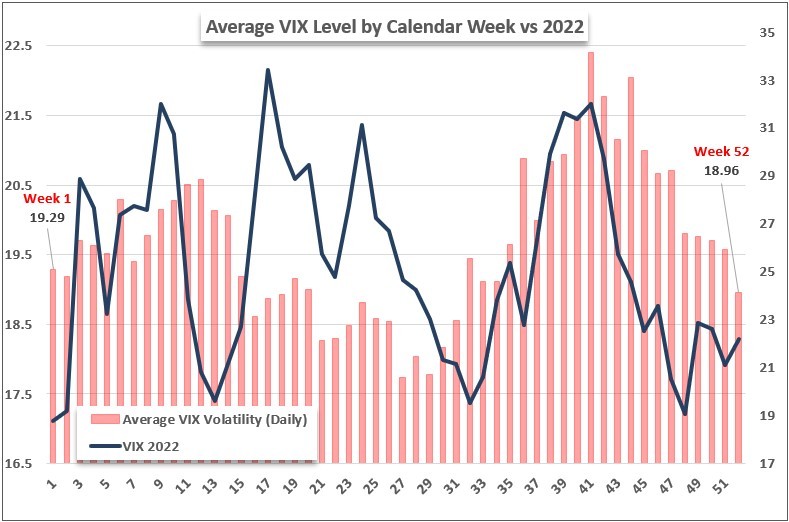
Chart Created by John Kicklighter
A last thing to contemplate heading into the new year. Changing out a comparison of the opening week and month of every year going back to 1950 (or 1990 in the case of the VIX), it is worth narrowing the evaluation to just this past year. The circumstances were very unique relative to the historical average as we transitioned from profound risk-seeking complacency into the progressive slide that we ultimately rendered through the end of the year. Given that the S&P 500 was range bound these past few weeks, it doesn’t seem that there is a short-term skew in speculative positioning that will prompt an unwind. Volatility on the other hand is particularly low and seems more at risk of accelerating earlier than what we realized in January 2022. Ultimately, it pays to know what the historical averages are when it comes to market performance; but this should only set a backdrop to interpret as we analyze the unique developments that will unfold as we move into 2023.
Chart of S&P 500 with Volume and VIX Volatility Index Focusing on January 2022 (Daily)
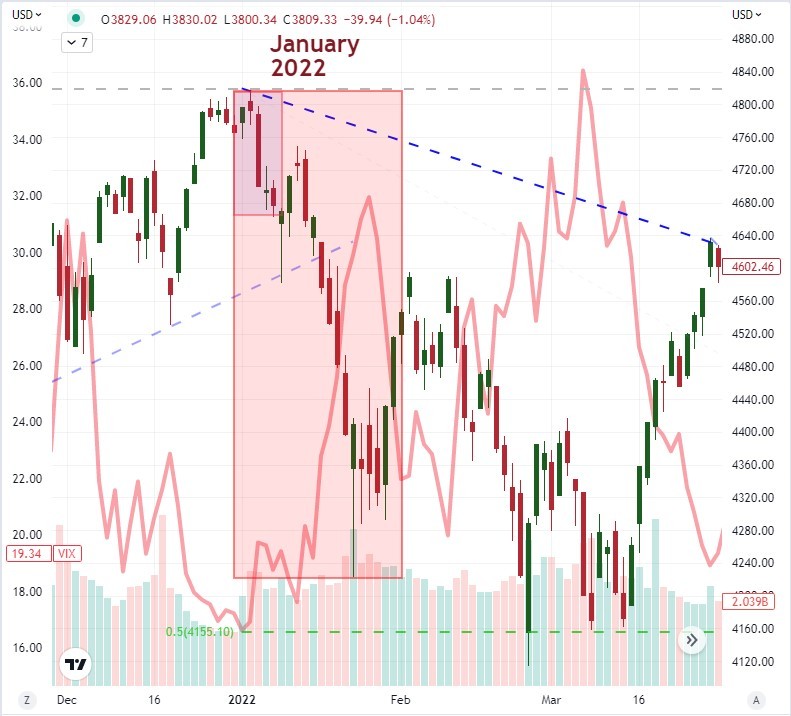
Chart Created on Tradingview Platform


