


S&P 500, Sentiment, FOMC, Dollar, USDJPY and VIX Talking Points:
- The Market Perspective: USDJPY Bearish Below 137; GBPUSD Bullish Above 1.2300; S&P 500 Bearish Below 4,030
- The S&P 500 continues to develop its remarkably tight (now 18 day) range with notable event risk ahead in the UofM survey, but a full break would be difficult to muster
- While the anticipation for the heavy run of event risk next week can curb many assets’ ability to run a break, some Dollar pair ranges are so tight, it could spark a run before the Fed

We are coming into the end of the week with unresolved technical ranges. For those that are on a constant vigilance for breakouts or dramatic reversals, it would seem that there are the technical pieces in place for such moves from the likes of the US indices or the Dollar, but we critically lack the liquidity backdrop and fundamental motivation to pull the crowd into a clear direction. The anticipation for next week’s deluge of data (rate decisions, inflation data, broad growth proxies) will sideline many market participants’ willingness to cast conviction – even if there are some provocative technical breaches. Putting these conflict of circumstances into context, consider the S&P 500. Volume and open interest (measured in futures, options and ETF exposure) behind the benchmark has deflated in part due to seasonal trends.
Yet, when we consider the scope of the past 18 day range – since we broke above the 100-day SMA following the last CPI release – we are left with the restrictive span of trade in 12 months at 4.9 percent of spot. That may seem to breakout fodder but for the fact that we have a single day left in the week. The average daily range over the past 10 days is only 1.5 percent and we closed Thursday 1.4 percent above the midpoint of the August to October range which seems to be a popular level of support. It is possible to make a move to that boundary and subsequently break, but that would be an outlier. A path of least resistance for any last minute volatility for the week would be a further bounce up into the established range towards the 200-day moving average and last week’s swing high, but that productive depends on what motivations we can find.
Chart of the S&P 500 Overlaid with 20 and 200-Day SMAs, Inverted VIX and 20-Day Correlation (Daily)
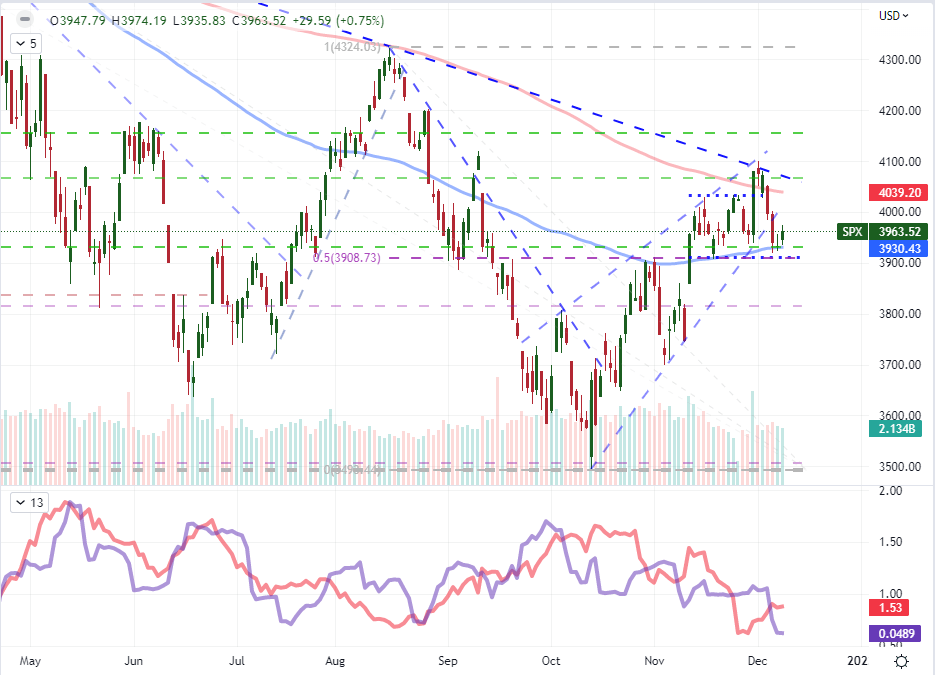
Chart Created on Tradingview Platform
For substantive scheduled event risks on the docket for the final 24 hours of run this week, we have a few fundamental stand outs. The Chinese inflation data for November may offer some important insight for a congested USDCNH, but it is hardly a well-known macro catalyst. Setting aside the New Zealand data given the Kiwi’s penchant to also discount its local data and the emerging market listings, there is a run of US data that should be monitored for anyone that is sporting Dollar exposure or considering a position. I am watching the Fed’s quarterly financial accounts and the WASDE report for agricultural trends for a financial growth check, but these carry more weight for longer macro themes rather than stir the interests of short-term traders. The only event with recognition and impact credentials while also tapping into a deeper theme is the University of Michigan consumer sentiment survey for December. This is the leading sentiment report out of the US, reflecting on the trends that precede actual consumption heading into important holiday shopping season with a backdrop of a possible recession and the knowledge that the Fed will also be watching. There is potential here, but the markets will dictate its impact.
Macro Economic Event Risk for Next 24 Hours
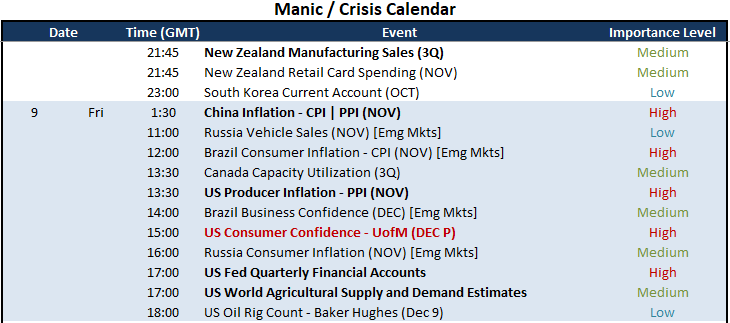
Calendar Created by John Kicklighter
If the UofM sentiment survey is capable of tapping into a more serious fundamental vein for the market, it is likely that either its ability to alter the course of the FOMC’s next move is the most potent option for context with its insight into potential economic hardship going forward (aka ‘recession risks’) being the secondary exposure. When it comes to tipping the scales on consensus for economic health, offering total relief form the many troubles we have been wading through is impractical; but triggering fear is a much lower threshold. Fear of a collapse in consumer spending and thereby a hastened charge into recession is the more impactful scenario, though it is still a lower probability. While that may seem negative for the US, it could actually translate into a bid for the Dollar as a more direct safe haven. As for interest rate expectations, we have seen the forecast for the December 14th meeting oscillate only modestly with a little more swing in forecasts into 2023 where the terminal rate is believed to be. The trend has been towards a cooling Fed forecast as peers close the gap, but we have practically seen expectations of the RBA and BOC terminal rate already essentially being put into place in swaps and futures. Could the Dollar mount a pre-FOMC rebound to shake loose some of this discount? If so, I’ll be watching the very tight range from GBPUSD as it forms a head-and-shoulders pattern.
Chart of the GBPUSD with 200-Day SMA (2 Hour)
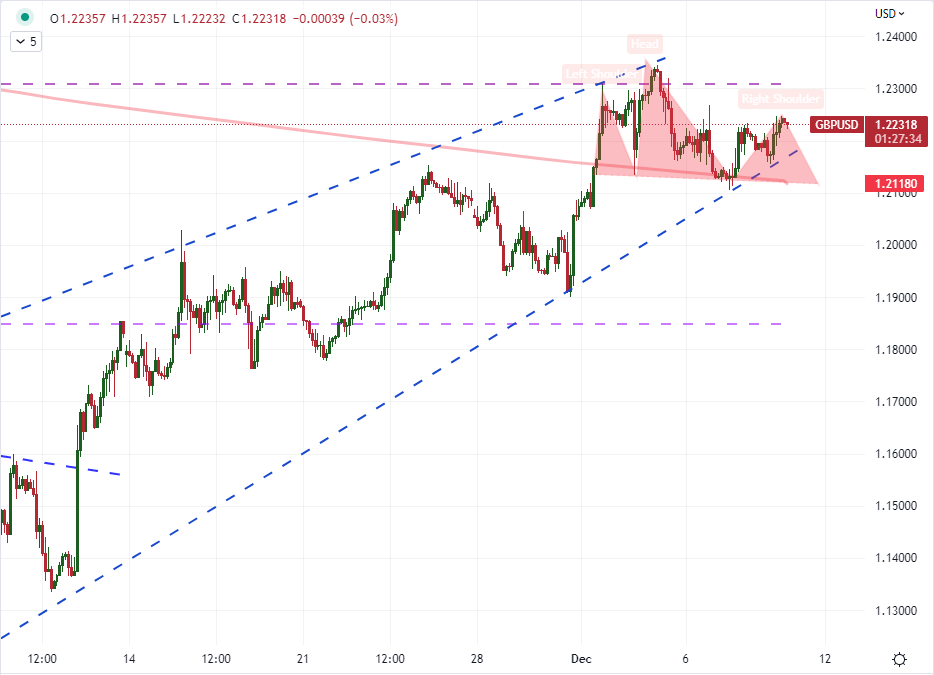
Chart Created on Tradingview Platform
In more practical terms, we may very well see some Friday activity; but it is likely to hold to the more provocative ranges. That doesn’t make the markets ‘untradable’, it just means that expectations and approach need to be adjusted. Looking out to next week, the docket will get far busier. I will go into more detail over what’s ahead in the weekend analysis, but an abundance of high profile event risk does not guarantee volatility (as anticipation for the next day’s events can curb the impact of today’s) and it is even more problematic for trends (either the data has to all align or the market decide that one particular listing is of far greater importance than everything else). Remember this for Friday expectations and in preparation for next week.
Top Macro Economic Event Risk for Next Week
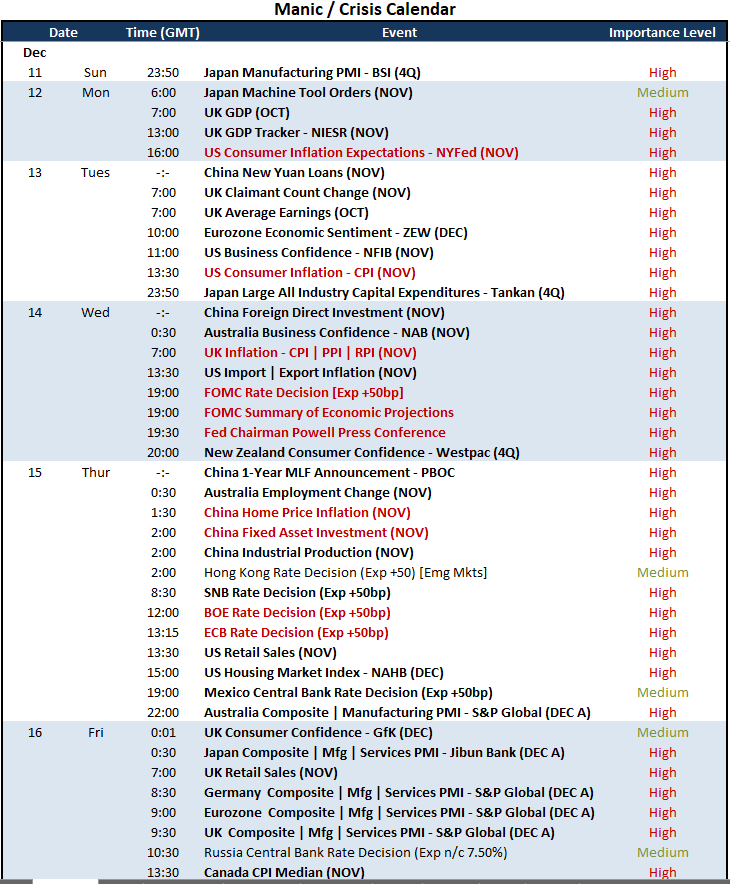
Calendar Created by John Kicklighter
Another look to history to set the stage for expectations: the historical averages for the VIX volatility index have shown that we have had outlier periods in the holiday seasons (November into December) back in 2021, 2020 and 2018 most recently. However, since the VIX has been tracked (1990), there is a very notable statistical uptick in the 50th week of the year. That is the week in which we typically get the FOMC rate decision and the last run of major data across the developed world before the holidays. If trading the volatility, that can be useful; but establishing a view of trends from this period may be misleading.
Chart of VIX Volatility Index 2022 and 2021 with Average Weekly Historical Level
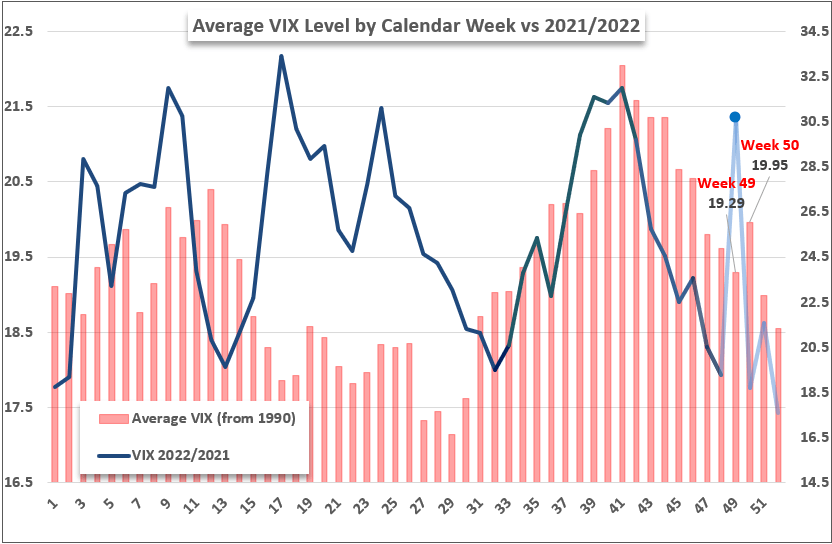
Chart Created by John Kicklighter
Trade Smarter - Sign up for the DailyFX Newsletter
Receive timely and compelling market commentary from the DailyFX team


