


Dow, Risk Trends, Inflation and CPI Talking Points:
- The Market Perspective: Dow Bearish Below 34,350
- US consumer inflation was growing at a faster pace than economists expected in January, but the resultant boost in Fed rate expectations didn’t trigger a clear Dow tumble
- Market rate expectations are reaching potentially excessive levels, but it may be technical considerations that ultimately decide the equity market’s next move

For some, this past session’s top scheduled event risk – the US CPI update for January – was a disappointment as it didn’t resolve a clear break higher or lower for top ‘risk’ benchmarks like the Dow Jones Industrial Average. However, a look back at previous releases in the series suggests that a lack of conviction on the day of the release has been the norm rather than the exception in recent months. Below, is a chart of the Dow with the daily candles highlighted indicating the release of the past six inflation reports. There were some exceptionally progressive moves in the first three releases indicated on the chart. The July CPI figure showed the year-over-year pace had peaked from the previous month’s 9.1 percent to 8.5 percent with the August 10th release. The sense of relief resulted in a strong gap higher above the 33,000 level where the market had previously stalled out.
The August reading ticked lower to an 8.3 percent annual pace on the September 13th release, which seemed to have disappoint the market – particularly after the previous four-day rally – as a 0.2 ppt drop was significantly slower than the 0.5 ppt retreat the previous month. The gap down on that session was sizable, but the subsequent selloff rending an overall -3.9 percent drop that was the largest single day loss for the index since June 11th 2020. Surprisingly, the September update notched only a 0.1 ppt deceleration (to 8.2 percent), but that wouldn’t keep the market from recovering from an opening gap lower and ending the day 2.8 percent lower – notably before starting its progressive climb through October and into November. From there the trend consideration started to taper significantly.
Chart of Dow Index with 50 and 200-Day SMAs, Gaps and CPI Release Dates (Daily)
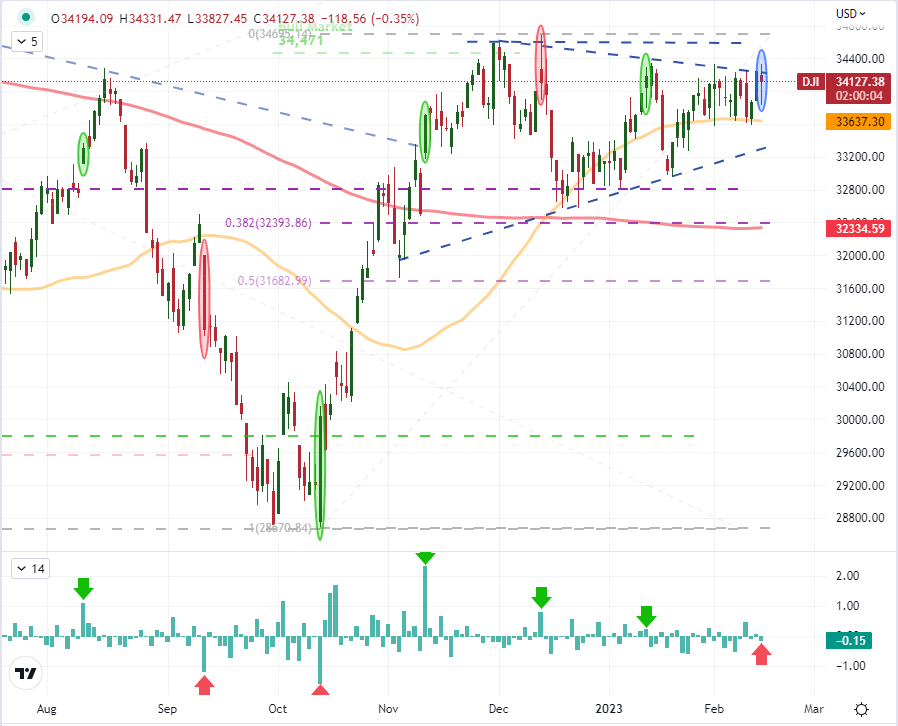
Chart Created on Tradingview Platform
In pure sentiment terms, the October CPI release released on November 10th was arguably market-defining. For the Dow, the response was a bullish charge that would clear trendline resistance from the January 2022 high to that point, but it was far more significant a transition for the DXY Dollar index. For the blue chip equity index, the gap was sizable, but the follow through day-of and beyond was noticeably more tepid. On December 13th and January 12th, the drop in pace jumped dramatically with 0.6 ppt decreases in the November and December readings (to 7.1 and 6.5 percent respectively), but the market response significantly dampened. So, to see an aimless response to the slight further drop in the inflation figure’s pace to 6.4 percent shouldn’t really surprise. What’s more, if the Dow would hold its now overt range of resistance through two significant drops in CPI; what would we expect from such a tepid data change? As you can see in retail CFD trader(at IG) below, there is strong confidence in the sanctity of the range. Net positioning has swung to approximately 75 percent of those with positions sporting short exposure on a significant jump in those ‘fading’ the resistance.
| Change in | Longs | Shorts | OI |
| Daily | 19% | -12% | -1% |
| Weekly | -3% | 0% | -1% |
Chart of Dow Jones Industrial Average Overlaid Retail Speculative Positioning at IG (Daily)
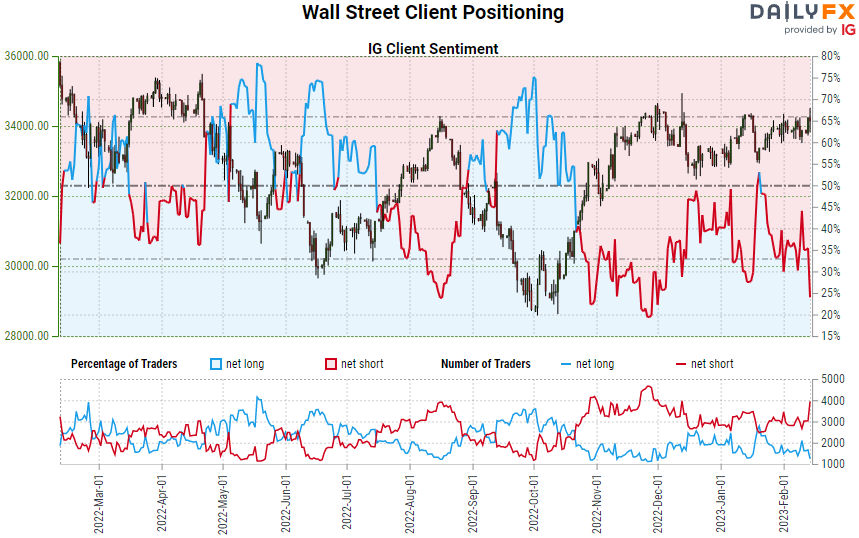
Chart Created on DailyFX
For those that only consider fundamentals through the initial and short-lived impact of scheduled event risk (and certainly those that disregard the analytical technique altogether), the influence of the CPI has passed and we will move on to some other force. However, I do believe that the event has tapped into deeper systemic currents that will continue to draw on the implications of today’s data. Fed rate expectations have pushed even higher with the subsequent financial hardship factoring into growth concerns (at least with the US 2-10 spread hitting a new 41-year low inversion). That said, there will be heightened sensitivity around what course monetary policy and growth potential will pursue. With retail sales, industrial production and housing sentiment (from the NAHB) on tap for Wednesday; there will be an opportunity to assess economic health. After that, factory and import inflation will interlace with Fed speak to remind the market that it is pushing against stubborn price pressures and an equally stubborn central bank.
Calendar of Major US-Based Economic Event Risk
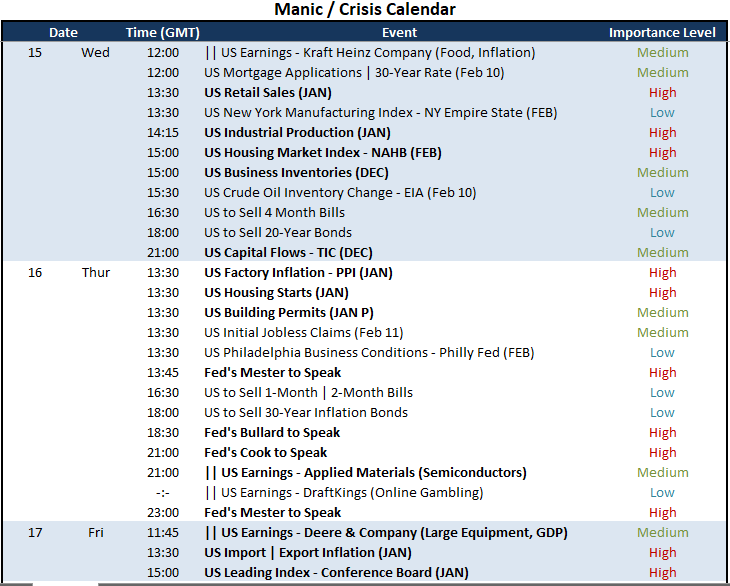
Calendar Created by John Kicklighter


