


USDJPY, Volatility, BOJ and Fed Rate Forecast Talking Points:
- The Market Perspective: FTSE 100 Bearish Below 7,300; Dow Bearish Below 32,400
- The -3.8 percent drop from USDJPY Tuesday in the aftermath of the BOJ adjustment was the biggest single-day drop since October 1998
- Today’s trade has been a marked downshift in activity - and certainly direction - but the technical support in the vicinity likely has less to do with the shift than broader liquidity conditions

It would not be a stretch to say the Japanese Yen’s move this week has been the most remarkable development across the major markets. In a period where most financial assets are struggling to muster significant breaks or trend development, the benchmark USDJPY posted its biggest single day drop in 24 years and subsequently added serious weight to the possibility that we have seen a structure trend shift from the almost-test of the 152.00, multi-decade high back in October. That said, technical breaks alone do not define trends. Generally, fundamental themes can feed momentum, productive speculative appetite can guide markets and thin technical barriers can prove conducive to follow through. The current backdrop doesn’t offer much inspiration on any of these fronts however.
While the monetary policy backdrop has shifted with the BOJ’s modest move this week and the market remains highly skeptical of the Fed’s options in 2023, it will be difficult to project speculation on these themes. In large part, the restriction is from the limitation in liquidity that we are looking at through the rest of this week and next week. Holiday conditions thin the transmission of highly-debatable, thematic forecasts that are wont find meaningful resolution for weeks or months out into the future. If that is the case, the probabilities of earning another significant break lower from USDJPY below the convergence of the 131.50 support/resistance level and the 38.2 percent Fibonacci retracement of the June 2016 low to this October’s high at 131.75 will be materially more difficult to achieve. The ‘path of least resistance’ would be a bounce that eases back on speculative shorts that recognize the deceleration.
| Change in | Longs | Shorts | OI |
| Daily | -2% | 2% | 0% |
| Weekly | 12% | -16% | -6% |
Chart of USDJPY with 20 and 200-Day SMAs (Daily)
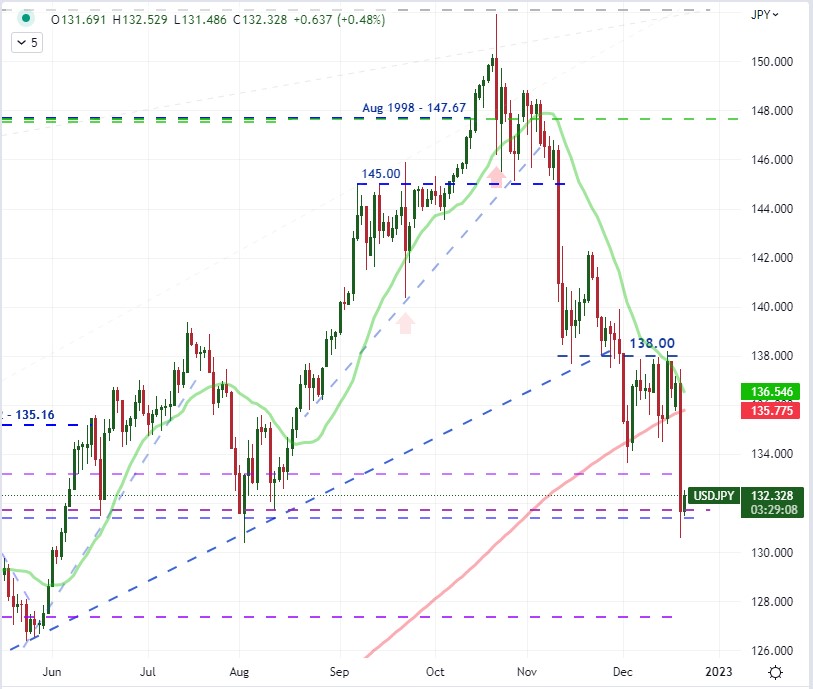
Chart Created on Tradingview Platform
One of the more credible threats to upending the norms of market conditions would be the development of an unexpected threat to risk appetite. While charges in volatility are well served by the passage of known events, the unpredictable developments can generate more weight. Generally, sudden swells of fear are more likely to catch in the market than impromptu ebullience when faced with thinned market conditions. Typically, a surge in fear (which I am using the VIX to illustrate below) is associated to a drop in the Yen crosses – or rise for the Yen itself. That is due to the prevalence of carry trade which exploits the lower yield JPY on the short side against a long view on higher yielding currencies like the US, Australian or New Zealand Dollars. When risk aversion kicks in, the need to unwind that exposure pulls those pairs lower. That would translate into a ‘negative correlation’, but as we can see in the chart below: the correlation is actually a fairly strong positive relationship. That likely has more to do with the Dollar’s own role as a safe haven aligning more closely to broader markets, but it would distort one of the most capable, unpredictable catalysts that would otherwise be expected as a spark for another USDJPY leg down – and would instead potentially bolster a rebound back into the range.
Chart of VIX Volatility Index and USDJPY with 20 and 60-Day Correlation (Daily)
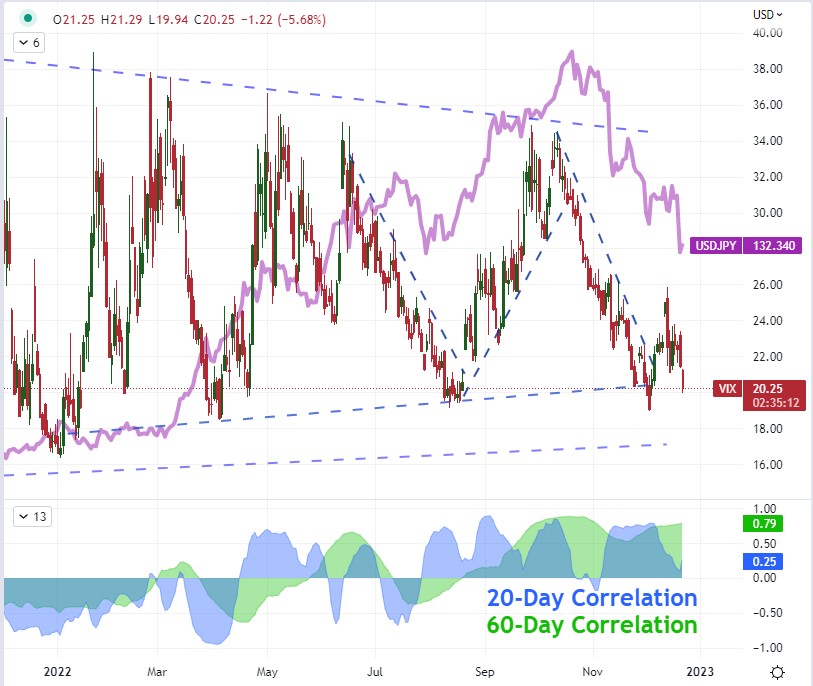
Chart Created on Tradingview Platform
From market conditions to fundamental themes, the implications of the BOJ downgrade may not represent the most inspirational driver for bearish conviction. There is a serious speculative influence when it comes to a factor like monetary policy differentials, and those forces are stronger when there is a shift from the extreme – such as the Japanese central bank moving back from its most extreme dovish setting in years. That said, thinned liquidity conditions will mark more shallow channels for the speculation to develop. This is a consideration that I will contemplate well into 2023; but for now, the disparity in the USDJPY’s tumble and the actual US-Japanese 10-year differential is striking. While the BOJ allowed the JGB yield to rise, the US counterpart’s own move in sympathy essentially offset the modest shift. In other words, the actual carry differential didn’t change. So, is this a move of symbolism (which requires more liquidity) or practicality? If it remains the latter, it could be another force that supports a USDJPY bounce.
Chart of USDJPY Overlaid with US-Japan 10-Year Yield Differential and 20, 60-Day Correlations (Daily)
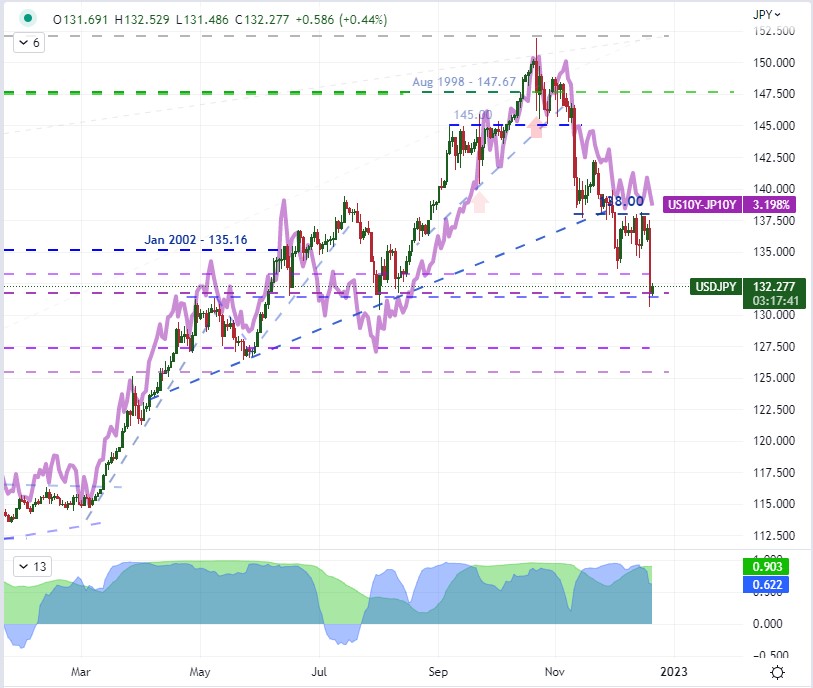
Chart Created on Tradingview Platform
Looking for scheduled event risk that could stir the USDJPY to life, there are a few events that I would watching closely. Naturally, the US Dollar has exacted greater influence on this pair – and most crosses – over time, so I will be watching the Conference Board’s Leading Index update tomorrow and the PCE deflator on Friday. The former has been increasingly interpreted in headlines as a recession signal, but it is still less known in trading circles. The latter is the Fed’s favorite inflation indicator, but it comes in the twilight hours before the holiday weekend and would likely require a significant surprise to leverage a meaningful move. Normally, I would focus much less on Japanese data for USDJPY, but the BOJ’s dovish relent this week could draw closer attention on the November CPI release Friday morning.
Chart of Noteworthy US and Japanese Macroeconomic Event Risk Through Week’s End
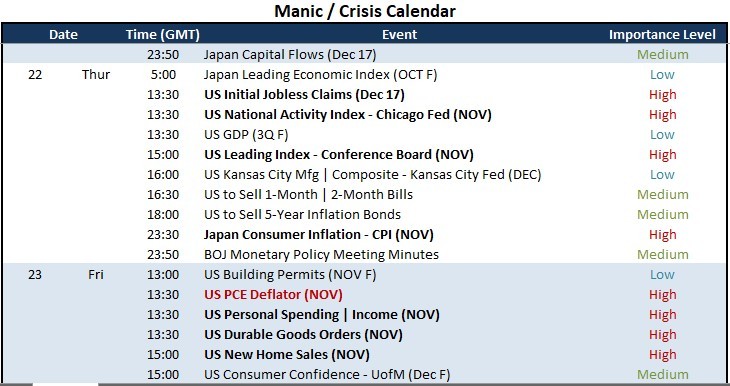
Calendar Created by John Kicklighter


