


MEXICAN PESO TRADING SETUP:
- USD/MXN has been moving steadily within the confines of a horizontal channel since the beginning of the month
- A breakout, however, could be just round the corner
- The end of price action consolidation could pave the way for the next big move in the dollar/peso exchange rate
Trade Smarter - Sign up for the DailyFX Newsletter
Receive timely and compelling market commentary from the DailyFX team
Most Read: US Dollar Consolidation Continues as USD/JPY Breaks Above 150
Since the beginning of the month, USD/MXN (U.S. dollar – Mexican Peso) has moved steadily within the confines of a horizontal channel, ricocheting between its upper and lower boundary as seen in the chart below, a sign of indecision in the forex market. Despite this price action behavior, I would steer clear of range trading strategies as exotic pairs tends to be more unpredictable and volatile than major and minor FX crosses.
However, this does not mean there are no opportunities; in fact, an attractive setup may be developing for traders who are patient enough to wait for the right time. In the coming days, high-impact events on the U.S. economic calendar, such as the October PMI survey or the third-quarter GDP report, are likely to fuel elevated volatility, leading to wild swings in the exchange rate, which may create a window to consider breakout strategies.
Focusing on the 2-hour chart, there are two key zones worth keeping an eye on in the near-term on USD/MXN: support at 19.95 and resistance at 20.15. Personally, I would not look to play a bounce between these two regions, but rather a decisive breach of that interval on the assumption that it could trigger a strong and meaningful move in the direction of the breakout. Although it is impossible to predict the future with certainty, two potential scenarios could unfold once consolidation comes to an end.
If technical resistance at 20.15 is cleared on higher volume, USD/MXN could gather bullish momentum and go on to challenge 20.28, followed by 20.45. On further strength, the focus shifts to the September high near 20.58. On the other hand, if support at 19.95 is pierced on downside in a convincing manner, also on higher trading volume, prices could slide towards 19.84, followed by 19.75, the September swing low.
You May Like: US Dollar Primed for the Next Move Higher as US Treasury Yields Rally

USD/MXN TECHNICAL CHART
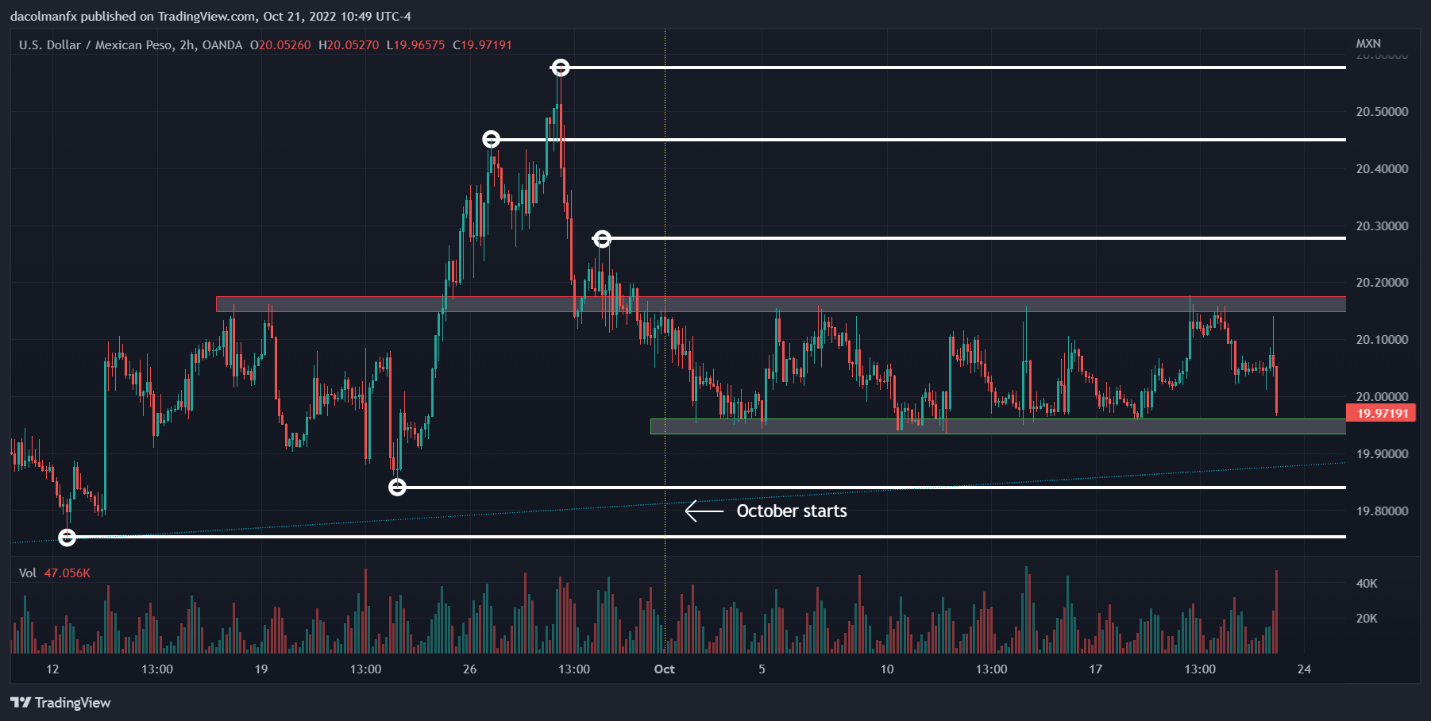
USD/MXN Chart Prepared Using TradingView
EDUCATION TOOLS FOR TRADERS
- Are you just getting started? Download the beginners’ guide for FX traders
- Would you like to know more about your trading personality? Take the DailyFX quiz and find out
- IG's client positioning data provides valuable information on market sentiment. Get your free guide on how to use this powerful trading indicator here.
---Written by Diego Colman, Market Strategist for DailyFX


