
S&P 500 FORECAST:
- S&P 500 rises but gains are modest amid cautious mood ahead of key U.S. economic data
- The June U.S. inflation release will steal the limelight on Wednesday
- Higher-than-expected CPI figures could spark a sell-off in risk assets, but a soft report could create the right conditions for a bullish breakout in the SPX

Most Read: British Pound Setups - GBP/USD Eyes Resistance as EUR/GBP Flirts with Breakdown
The S&P 500 rose on Tuesday, but gains were modest amid cautious sentiment ahead of a major market event on Wednesday: the release of U.S. consumer price index data. In this context, the equity benchmark climbed 0.40% to 4,427 in late afternoon trading, with the communications services and materials sectors leading the advance on Wall Street.
Focusing on the inflation report, headline CPI is forecast to have risen 0.3% month-over-month in June, bringing the annual rate to 3.1% from 4.0% previously, a welcome directional improvement for the U.S. central bank. The core metric is also seen inching up 0.3% on a monthly basis, but the 12-month reading is expected to remain sticky, cooling only to 5.0% from 5.3% in the preceding period.
INCOMING US ECONOMIC DATA
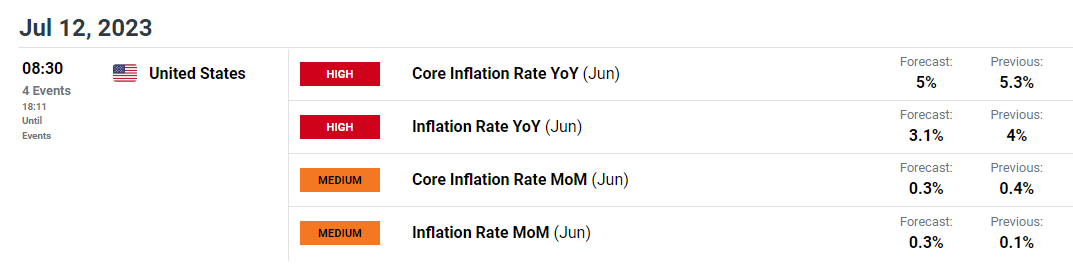
Source: DailyFX Economic Calendar
| Change in | Longs | Shorts | OI |
| Daily | 2% | 4% | 4% |
| Weekly | -12% | 25% | 7% |
Traders should stay laser-focused on the economic calendar, as incoming data could help guide the Fed’s next steps in terms of its normalization cycle. That said, an in-line or softer-than-projected CPI survey may not be enough to quash bets for another quarter-point hike this month, but could help reduce expectations for additional tightening beyond July. This could be positive for the S&P 500 and risk assets in general.
Conversely, if inflation numbers surprise to the upside, particularly the core indicator, the Fed's hiking outlook could shift in a much more hawkish direction, leading traders to price in another 25 bp hike for 2023 on top of the one already discounted for this month’s FOMC meeting. This scenario could be detrimental to equities given its underlying implications for the economy: a more hostile environment for corporate earnings and a higher likelihood of a hard landing.

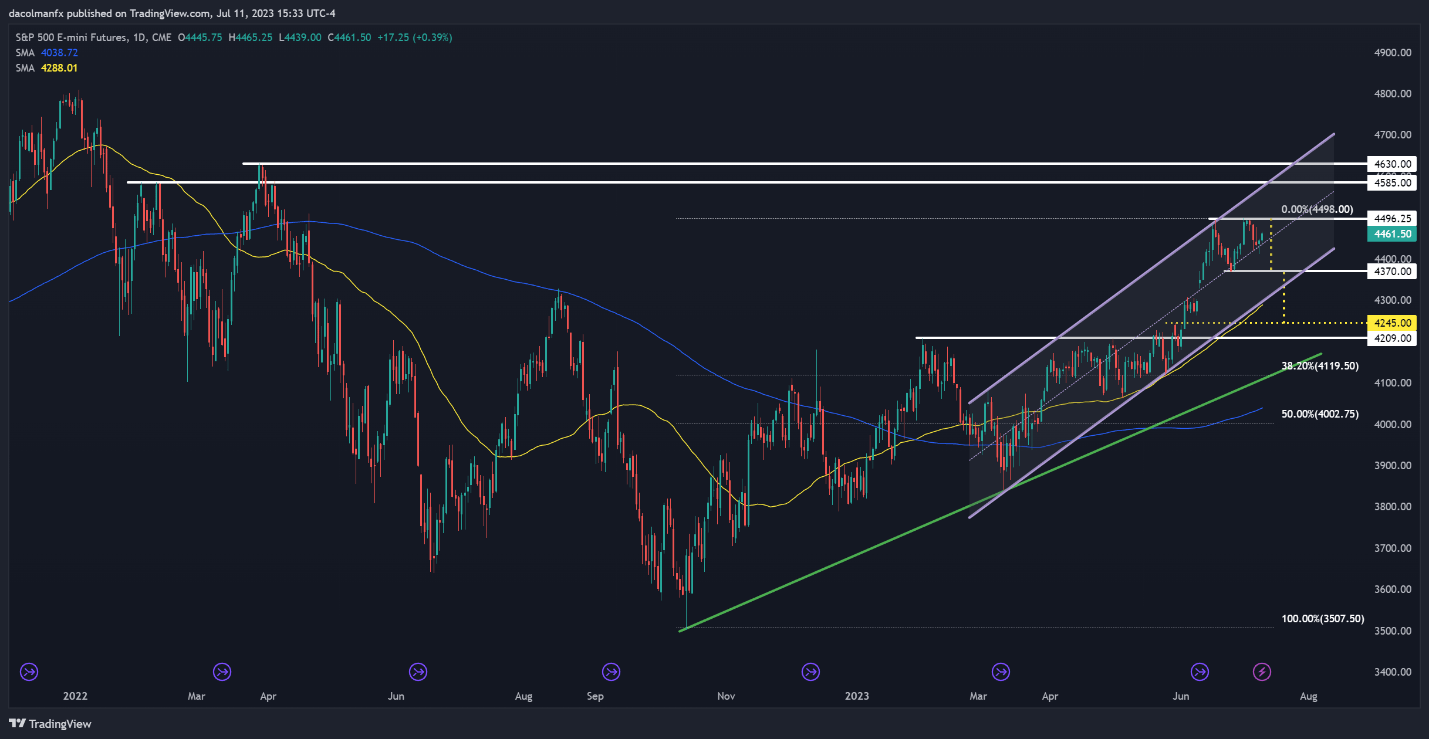
S&P 500 TECHNICAL ANALYSIS
The S&P 500 has been carving out a bearish double-top pattern since early June, but the technical formation is losing reliability and may become invalid if prices rise further and challenge their recent peak in the coming days. In this scenario, the index may have a hard time overtaking resistance at 4,500, but on a breakout, it could gather momentum to take off and charge toward 4,585.
On the flip side, if the S&P 500 shifts gears and begins to dribble lower, initial support appears at 4,370. Clearance of this floor would confirm the double top, creating the right conditions for a possible pullback toward 4,300, followed by 4,245.
S&P 500 TECHNICAL CHART