
S&P 500 TECHNICAL FORECAST:
- S&P 500 stalls at cluster resistance and pivots lower heading into the weekend
- Recent price action presents an attractive bearish set up for traders interested in betting on the possibility of a pullback
- This article looks at key tech levels to watch in the coming days

Most Read: Ethereum (ETH/USD) Back Above $2,100 as Sales Fears Subside
The S&P 500 gained ground in early trading on Friday, but then reversed course sharply heading into the weekend, stalling just a tad below a major technical ceiling, as bulls began to bail amid elevated market uncertainty. The reversal coincided with a powerful rally in U.S. Treasury yields, especially those at the front end of the curve, following solid corporate earnings from major financial institutions and rising near-term inflation expectations reflected in the April University of Michigan sentiment survey.
Strong quarterly results and, more importantly, constructive guidance from the likes of JPMorgan suggests that the banking stresses that erupted in March are beginning to abate, reducing systemic risks that could compromise and knock out the economy. While headwinds remain formidable, the sky is clearly not falling, at least not yet. Against this backdrop, Wall Street could soon begin to price out the rate cuts that were being discounted for the second half of the year, creating an adverse environment for stocks.
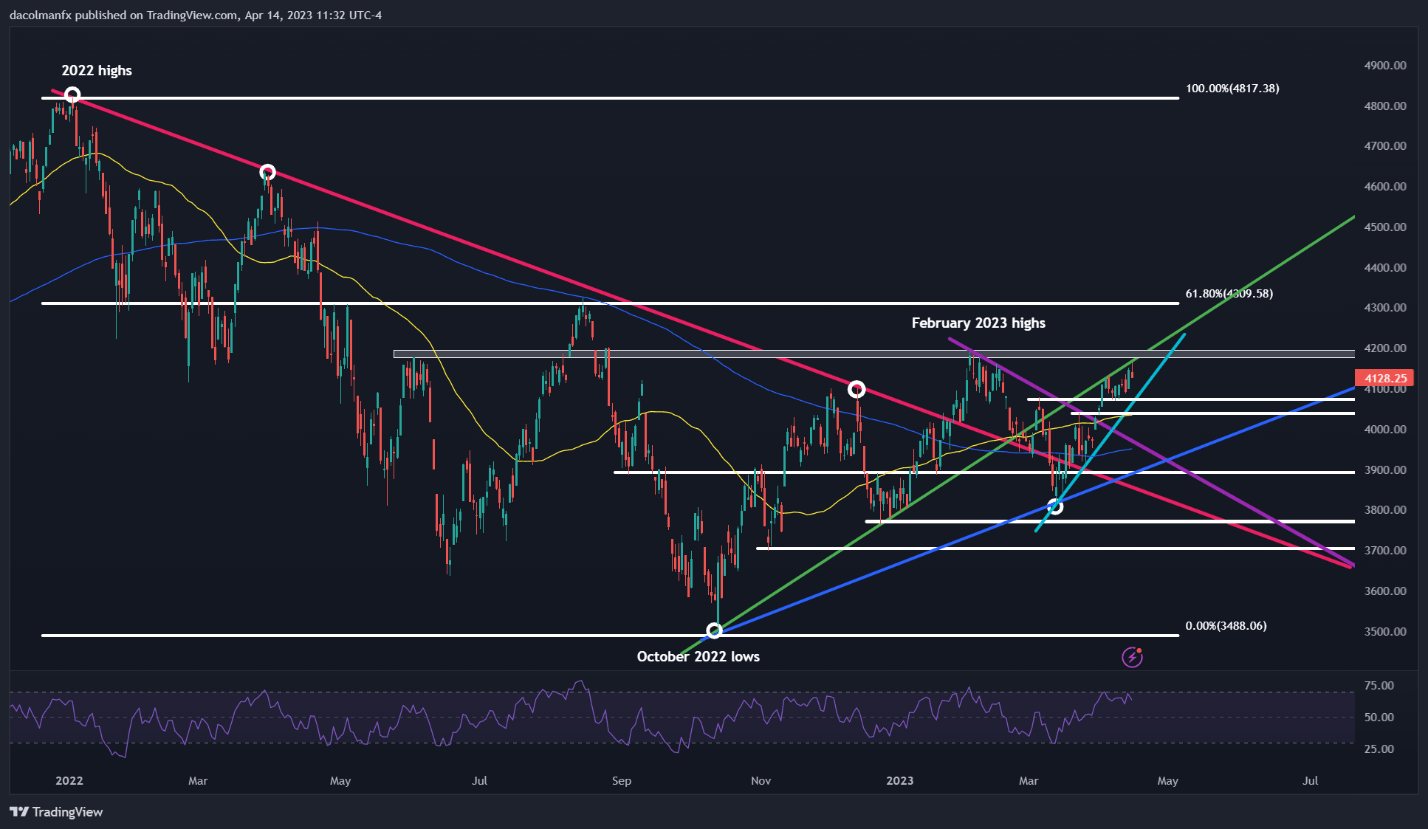
From a technical perspective, the S&P 500 presents an attractive bearish setup, with the RSI indicator close to entering overbought territory and prices steadily approaching cluster resistance in the 4,165-4,195 area, where the June 2022 and February 2023 highs converge with an important trendline in play since October of last year. This configuration may appeal to traders interested in betting on the possibility of near-term weakness.
Should the pullback scenario play out, the S&P 500 could head towards technical support at 4,075 in the coming days. On further losses, the next downside target corresponds to the 50-day simple moving average near 4040. On the flip side, if bulls regain decisive control of the market and manage to push the equity benchmark above resistance stretching from 4,165 to 4,195, the bearish setup would be negated, with a topside breakout exposing the 4,310 level, the 61.8% Fib retracement of the 2022 slump.
| Change in | Longs | Shorts | OI |
| Daily | 1% | -1% | 0% |
| Weekly | 15% | -13% | -1% |
S&P 500 TECHNICAL CHART