
S&P 500 OUTLOOK:
- S&P 500 rallies and closes at its best level since February 15, with the consumer discretionary and communications sectors leading gains on Wall Street
- Weaker-than-expected wholesale inflation boosts positive sentiment, increasing appetite for riskier assets
- The first-quarter earnings season will take center stage in the coming days, with key banks reporting financial results on Friday

Most Read: US Dollar in Freefall, USD/CAD Breaches Major Support, GBP/USD on Brink of Breakout
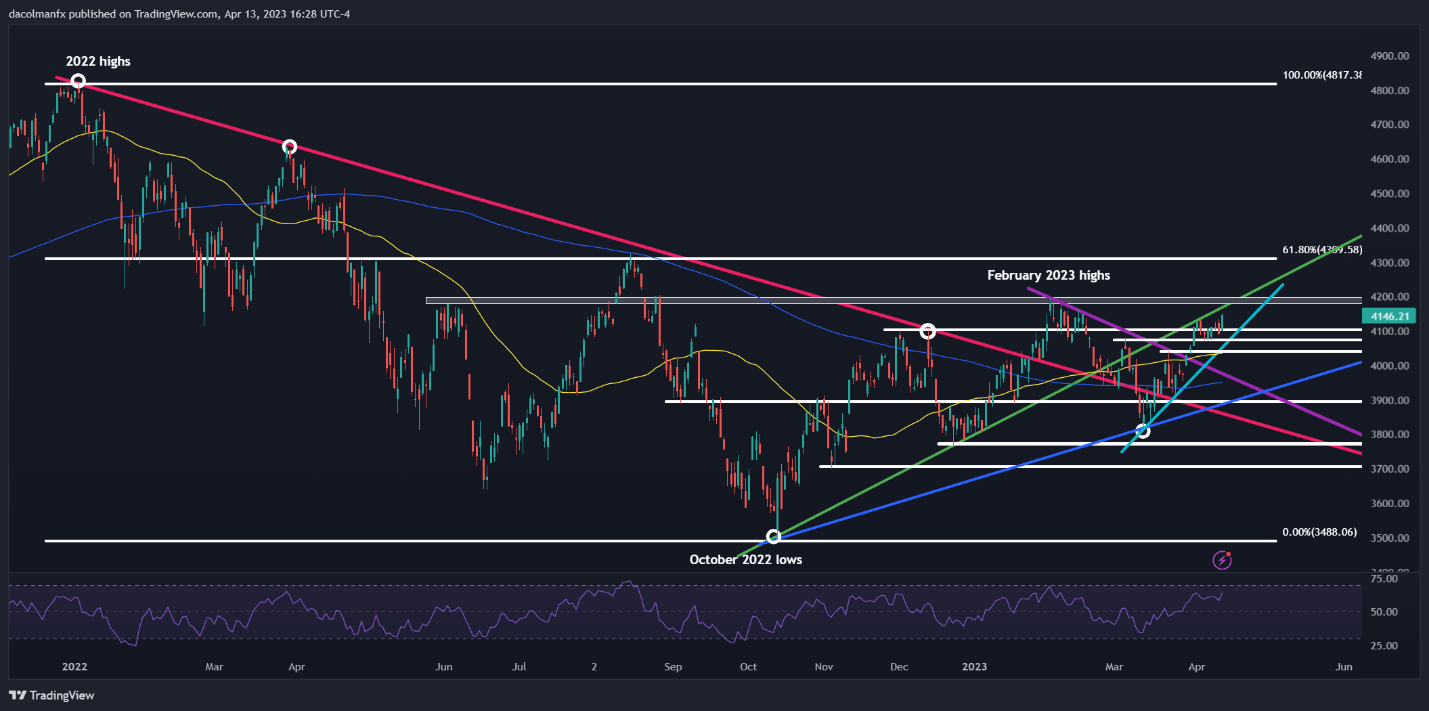
The S&P 500 surged on Thursday, rallying 1.33% to 4,146, its best close since February 15, supported by upbeat mood following weaker-than-forecast wholesale inflation data, with consumer discretionary and communications stocks leading gains and the real state sector underperforming. With today’s upswing, the equity benchmark finds itself hovering slightly below cluster resistance near the psychological 4,200 level, an area where sellers could pounce, stop the upside momentum in its tracks and trigger a pullback.
Sentiment was boosted early in the trading session after the March PPI headline figure surprised to the downside, clocking in at 2.7% y-o-y versus 3.0% y-o-y expected, the lowest reading since January 2021. The steady downtrend in wholesale prices will weaken inflationary forces in the economy in the coming months, reducing the need for additional rate rises. This means that the Fed’s tightening campaign could end soon, possibly after one final 25 bp hike at the May FOMC meeting.
Once the Fed pauses, traders will focus all their attention on interest rate cuts and the magnitude of the impending monetary policy reversal. While this scenario could be somewhat positive for risk assets initially, it will not be so in the medium term, as any easing by the central bank will likely respond to a deteriorating macro landscape and growing recession risks. Over time, a recessionary environment will not be supportive of corporate earnings or stock prices.

Focusing on short-term catalysts, the first-quarter earnings season, slated to start in earnest on Friday, will steal the limelight, with JPMorgan Chase (JPM), Wells Fargo (WFC) and Citigroup (C) set to unveil their results in the morning before the opening bell. Check out DailyFX’s new earnings calendar to see what Wall Street expects for each company in terms of EPS and revenue.
Commercial and investment banks, as lenders and deal-making institutions in the capital markets, have a front-row view of the economy, so traders should carefully examine their financial disclosures, but more importantly, their forward guidance, especially after last month's turmoil in the industry, which led to the failure of SVB and SBNY.
KEY CORPORATE EARNINGS COMING UP
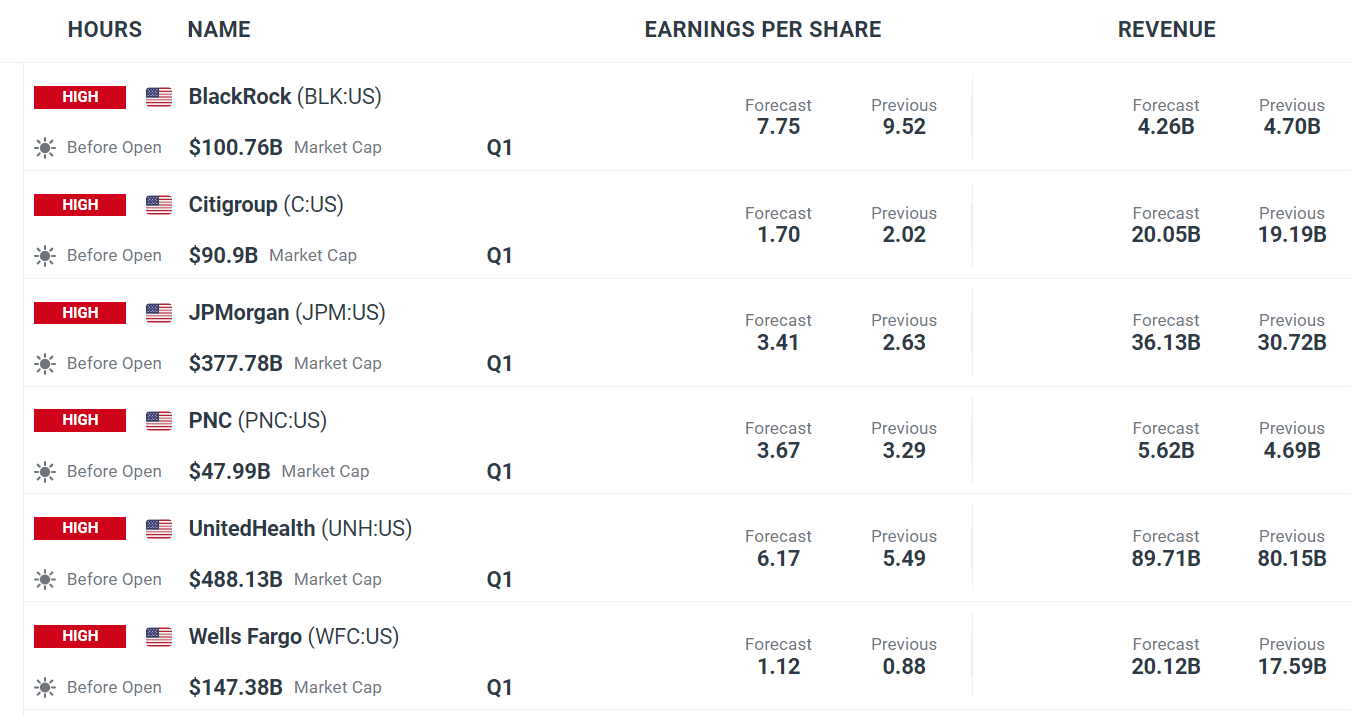
Source: DailyFX Earnings Calendar
| Change in | Longs | Shorts | OI |
| Daily | 2% | 0% | 1% |
| Weekly | -8% | 4% | -1% |
S&P 500 TECHNICAL ANALYSIS
After the recent rally, the S&P 500 has come within striking distance of a cluster resistance zone near the 4,200 level. If bulls manage to push prices above this technical barrier in the coming days, buying momentum could accelerate, paving the way for a move towards 4,310, the 61.8% Fibonacci retracement of the 2022 decline.
On the flip side, if the S&P 500 fails to push higher and pivots lower, initial support lies at 4,100, followed by 4,075. On further weakness, the focus shifts to 4,035, just a touch above the 50-day simple moving average.