
US DOLLAR OUTLOOK:
- The U.S. dollar extends losses and reaches its weakest level in more than two months following softer-than-expected PPI data
- USD/CAD breaks below trendline support, reinforcing bearish market signals
- GBP/USD attacks cluster resistance and eyes a potential bullish breakout

Most Read: US Dollar Extends Losses as Fed Minutes Flag Recession Risks amid Banking Sector Turmoil
The U.S. dollar, as measured by the DXY index, plunged on Thursday, retreating for a third straight session and hitting its lowest level in more than two months near 100.85, undermined by falling U.S. Treasury yields following a weaker-than-expected wholesale prices report. For context, March headline PPI contracted 0.5% m-o-m, bringing the annual rate to 2.7%, three-tenths of a percent below consensus estimates.
The rapid cooling of wholesale prices should translate into softer inflation readings in the coming months, reducing the need for further tightening and increasing the likelihood that the FOMC’s hiking campaign will soon come to an end. Once the Fed officially pauses, traders will turn their attention to the next easing cycle, reinforcing the downward pressure on bond yields and, therefore, on the U.S dollar.
With Thursday's slump in the U.S. dollar, FX volatility increased, pushing several key pairs to breach or reach key technical levels. That said, recent moves have created interesting trading setups in multiple currency crosses, including USD/CAD and GBP/USD. In this article we will explore attractive price action setups worth watching that traders should keep an eye on in the coming days and weeks.
| Change in | Longs | Shorts | OI |
| Daily | 15% | -17% | -6% |
| Weekly | 55% | -25% | -4% |
USD/CAD TECHNICAL ANALYSIS
USD/CAD has sank more than 1% since the start of the week, with the recent pullback pushing the pair below a key rising trendline and the 200-day simple moving average - a major bearish development for price action.
With sellers in control of the market, USD/CAD appears to be on track to challenge support at 1.3330, the next floor to focus on in the near term. If this barrier fails to hold and the exchange rate drops below it, bearish pressure could gather momentum, setting the stage for a retreat towards 1.3220.
Conversely, if dip buyers return and a bullish reversal takes place, initial resistance appears near the psychological 1.3400 level, followed by 1.3450. On further strength, attention shifts to 1.3510 and 1.3560 thereafter.
USD/CAD TECHNICAL CHART
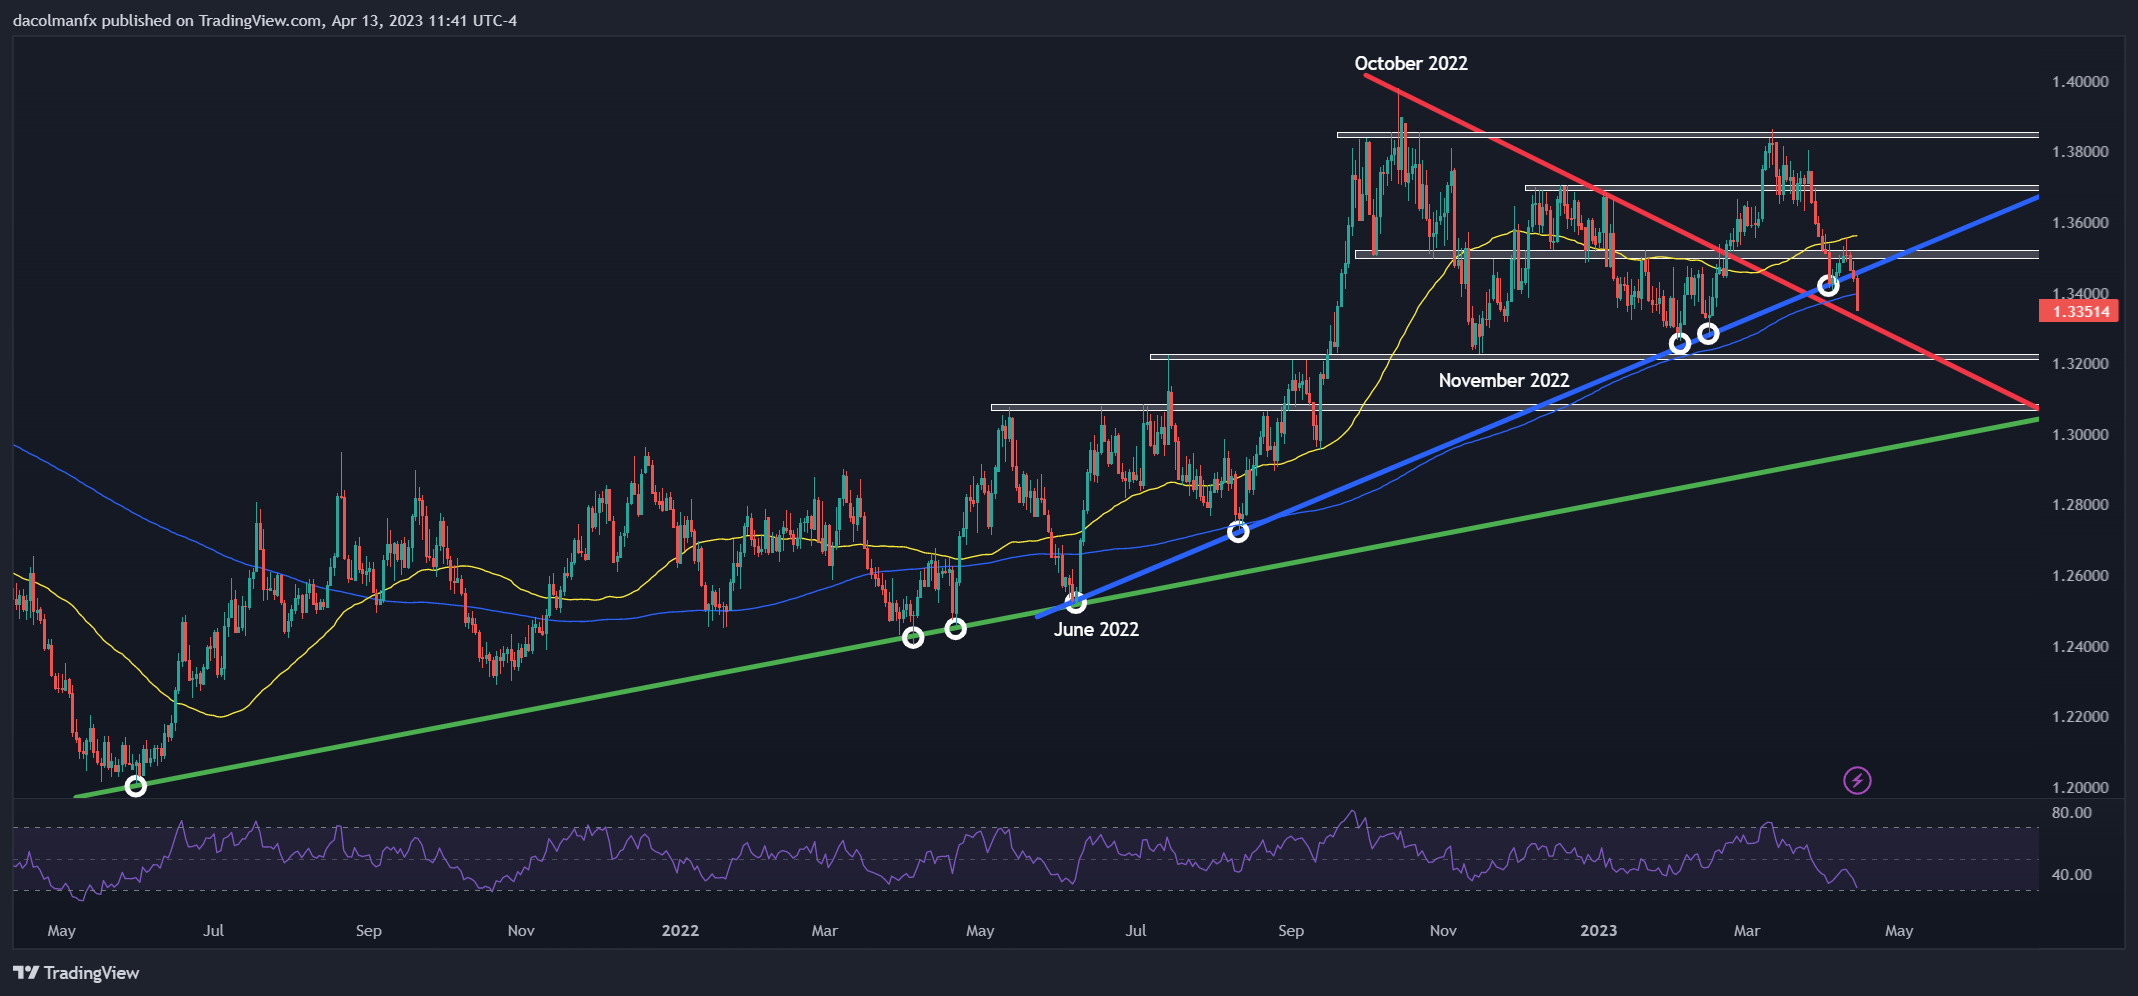
USD/CAD Chart Prepared Using TradingView
| Change in | Longs | Shorts | OI |
| Daily | -15% | 16% | -6% |
| Weekly | -3% | 0% | -2% |
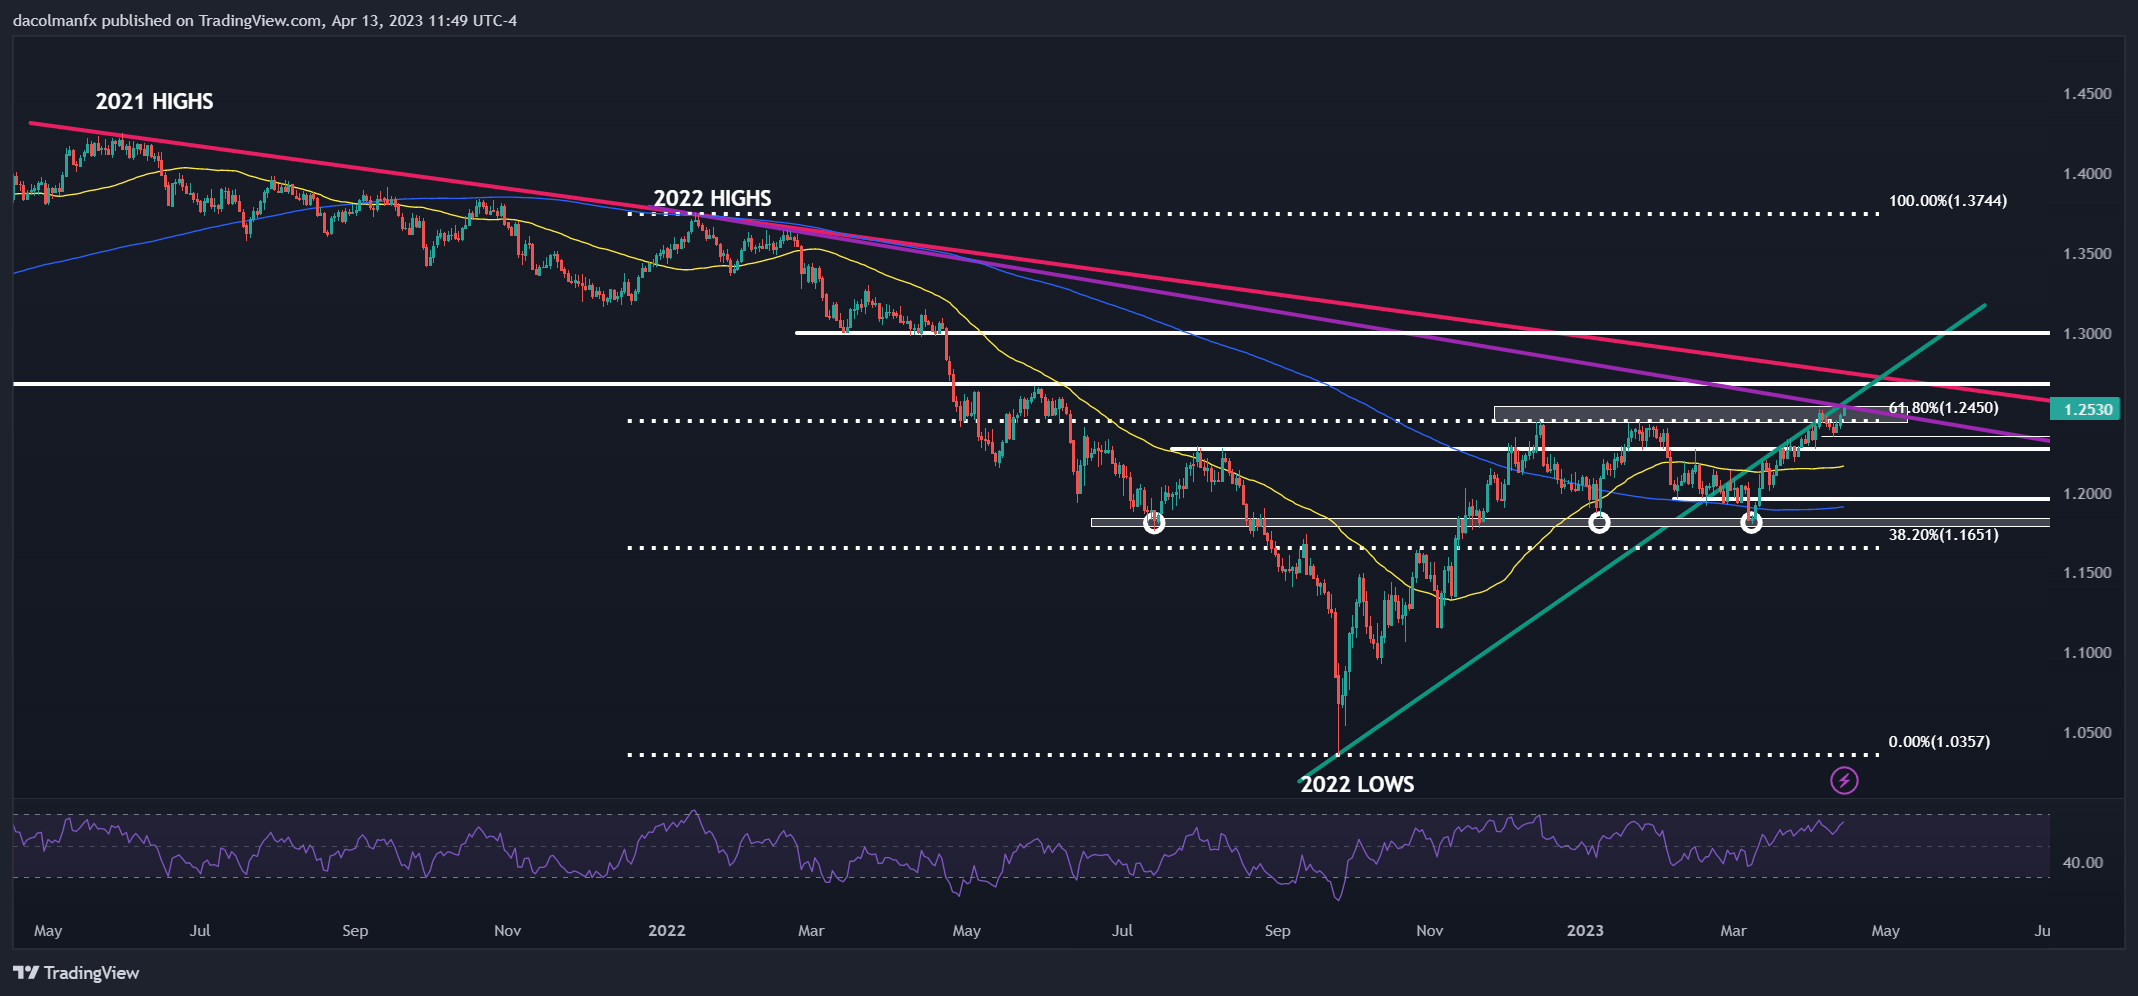
GBP/USD TECHNICAL ANALYSIS
After its recent advance, GBP/USD is hovering below major cluster resistance in the 1.2450/1.2530 region, where several trendlines align with the 61.80% Fibonacci retracement of the 2022 slump. If this ceiling is decisively breached on the topside in the coming days, bulls could launch an attack on 1.2680 in short order.
On the flip side, if prices are ultimately rejected from current levels and begin to retrench, initial support rests at 1.2350, followed by 1.2270. Below that floor, the next downside area of attention corresponds to the 50-day simple moving average located near 1.2165.
GBP/USD TECHNICAL CHART