


Silver (XAG/USD) Talking Points
- Silver prices recover large portion of recent losses – can prices break $24.00?
- XAG/USD rebounds off the 50-day MA (moving average), climbing above psychological support at $23.00.
- USD weakness persists ahead of this week’s GDP and inflation data.

Silver Prices Rebound Ahead of Upcoming Event Risk
Silver prices have bounced back after a brutal setback that resulted in a 1.59% decline yesterday. With the futures contract currently recovering over 1.00% of those losses, USD weakness ahead of this week’s GDP and inflation data has limited losses.
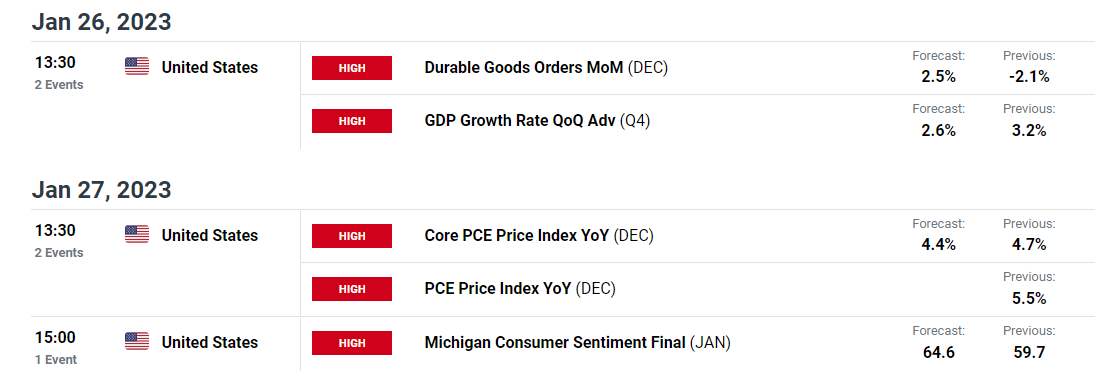
For all market-moving events and data releases, see the real-time DailyFX Calendar
Despite the ECB (European Central Bank) and Federal Reserve echoing their intention to continue to hike rates, a slowdown in growth forecasts has boosted the demand for safe-haven metals.
With both Silver and Gold holding a reputation as a hedge against inflation, expectations of a slower pace of tightening has overshadowed the hawkish narrative expressed by central banks.

Silver (XAG/USD) Technical Analysis
After a brief retest of the 61.8% Fibonacci retracement of the 2008 – 2011 move at 24.220, XAG/USD peaked at 24.775 in early Jan. Although bulls attempted to reclaim this level last week, a rejection of the 17 Jan high of 24.670 forced prices lower.
Silver (XAG/USD) Weekly Chart
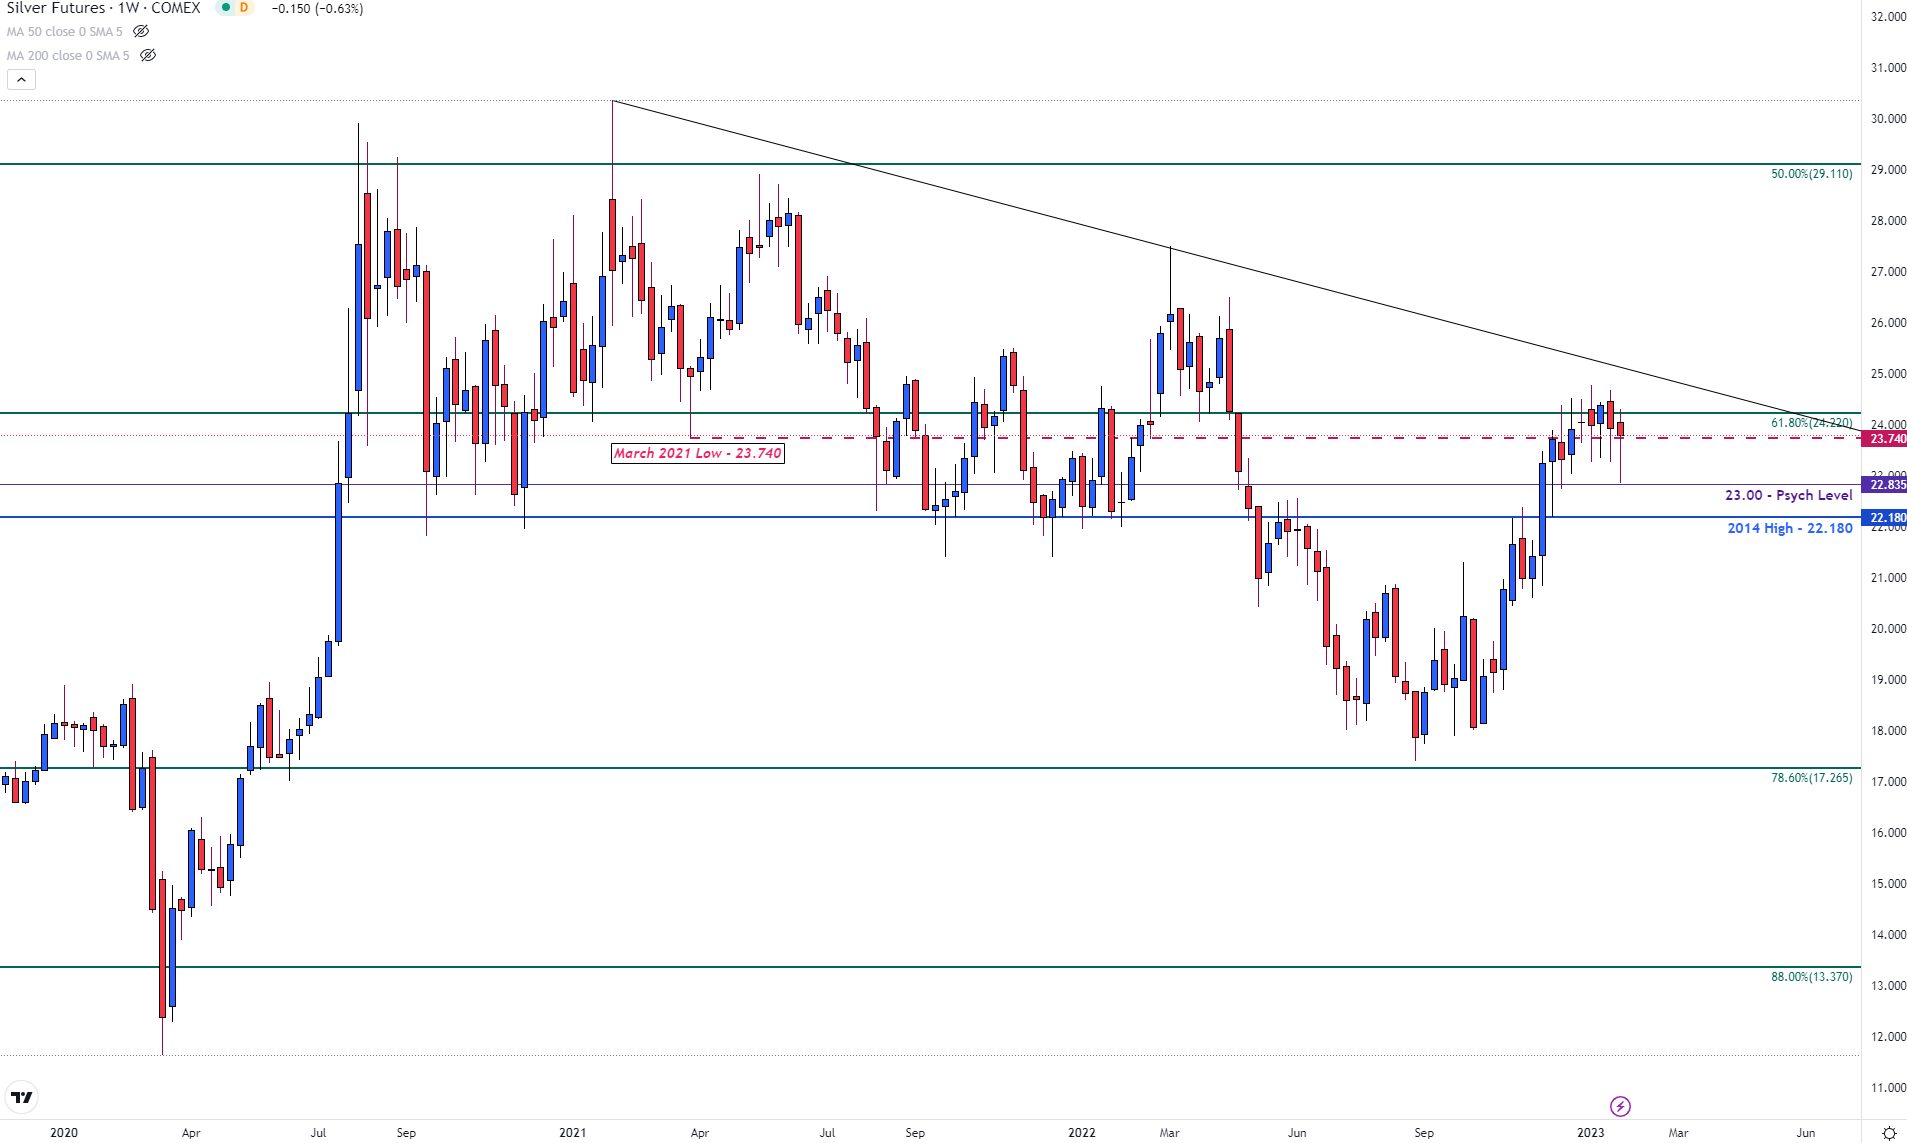
Chart prepared by Tammy Da Costa using TradingView
As the above-mentioned Fibonacci level continues to provide support and resistance for the short-term move, prices reached a high of 24.295 before moving lower.
While sellers took this opportunity to drive prices below psychological support at 23.00, the 50-day MA helped cap the downside move.
The swift retaliation from bulls to push Silver higher resulted in a long lower-wick appearing on yesterday’s candle. This suggests that both the psychological level and the moving average will likely remain as key support (at least for now).
Silver (XAG/USD) Daily Chart
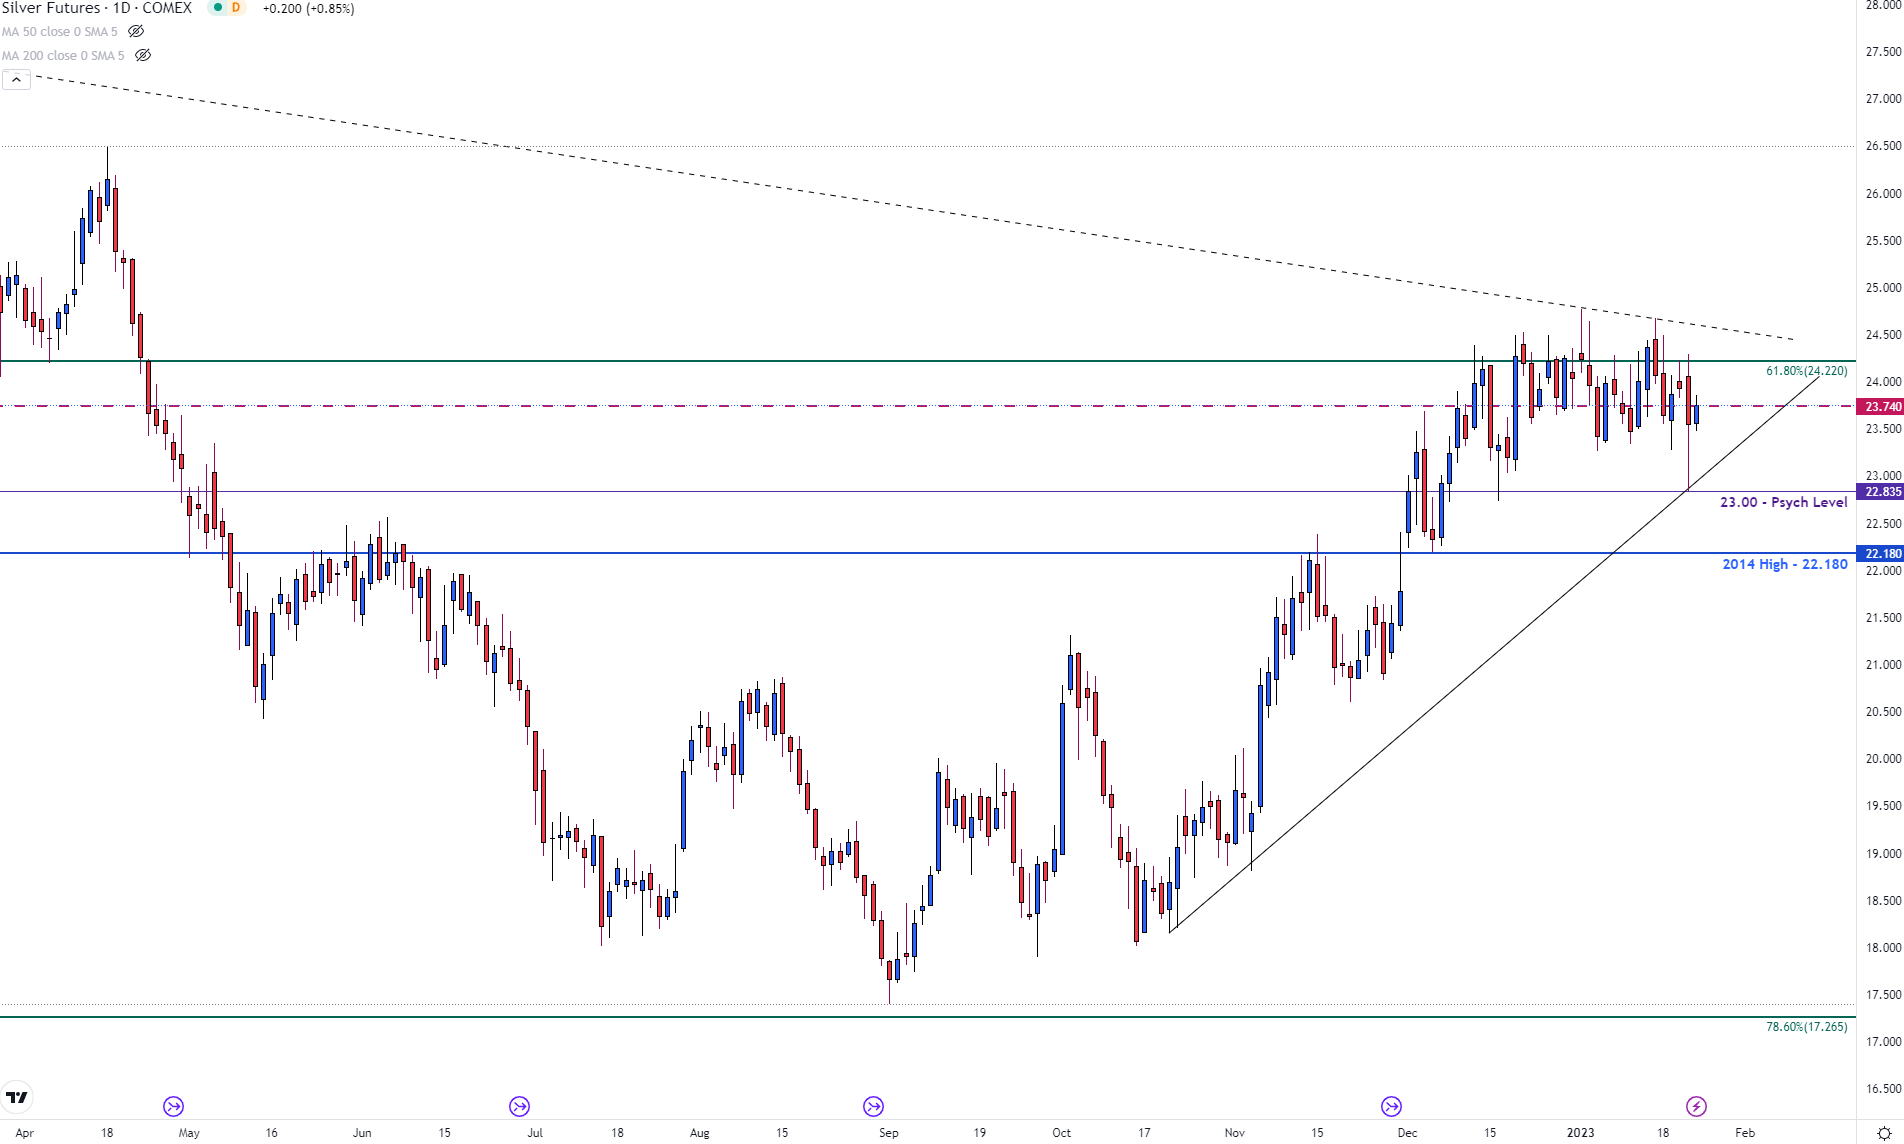
Chart prepared by Tammy Da Costa using TradingView
Silver (XAG/USD) Technical Levels
Looking ahead, a hold above 23.00 and above the March 2021 low of 23.740 could allow for bullish continuation towards psychological resistance at $24.00.Above that, bulls would need to clear the 24.220 Fib level which could pave the way for a move back towards last week's high of 24.670.
-- Written by Tammy Da Costa, Analyst for DailyFX.com
Contact and follow Tammy on Twitter: @Tams707


