


S&P 500, VIX Index, Financial Conditions, Event Risk and USDJPY Talking Points:
- The Market Perspective: USDJPY Bearish Below 141.50; Gold Bearish Below 1,680
- Markets have drawn to a close both the month of September and the third quarter; for the S&P 500, it was the second worst month’s hit since February 2008
- Seasonally, the month of October typically brings a peak in both volume and volatility; and for 2022, potential for financial instability has hit uncomfortable levels

S&P 500, Risk Trends and October Expectations
We are making the unusual transition from one week, month and quarter into a new period on each scale. Add to that the evolving backdrop around investor sentiment and economic forecast, and the course forward is rife with uncertainty. At quarter’s end in particular, there tends to be capital repositioning among funds for accounting purposes, so the tumble into this past Friday’s close should be taken with a significant grain of salt. The S&P 500’s -1.5 percent wasn’t a particularly severe move historically, but it did push the benchmark US index to its lowest close in 22 months and register the eighth session’s slide in 9 trading days. Those could be seen as solid bearish credentials if not for the caveat of the quarter-end adjustments. I will look to this new week (as well as month and quarter) with some sense of neutrality given the epic influences of 2022’s general risk course against the persistent hopes of the investment rank.
Chart of S&P 500 20-Day SMA with 20-Day Disparity and 1-Day ROC (Daily)
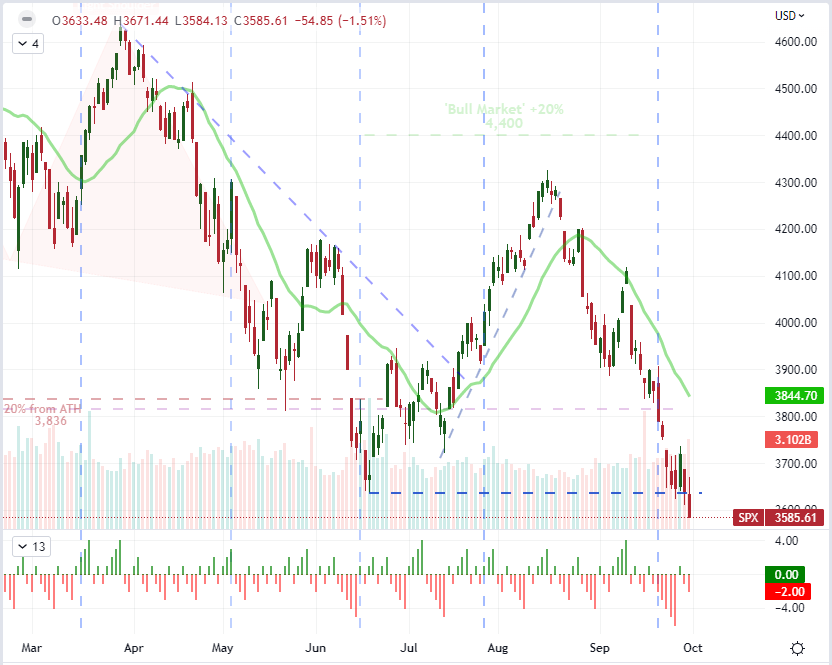
Chart Created on Tradingview Platform
In technical terms, the US indices have closed out the past week with meaningful breaks into essentially multi-year lows with fundamental fears encompassing significant recession threats. Should we tip the otherwise orderly concern around economic contraction into the realm of financial instability, for which we see risk on the fringes of liquidity measures, the backdrop will change dramatically. In the meantime, seasonal norms will go to work on market expectations moving forward. According to historical averages, the S&P 500 experiences a peak in both volume and volatility (via the VIX) in the month of October. That is a heady combination for market development that tends to see the severity of the situation dampened thanks to the average performance of the underlying index. Since 1980, the SPX has averaged a meaningful advance through October, which tends to curb the peak potential of volatility and participation should it follow the opposite course. That said, directionality in the underlying index carries serious disparity depending on the prevailing fundamental conditions of the given year; but turnover and activity level tend to be far more routine.
Chart of Average S&P 500 Performance, Volume and Volatility by Calendar Month
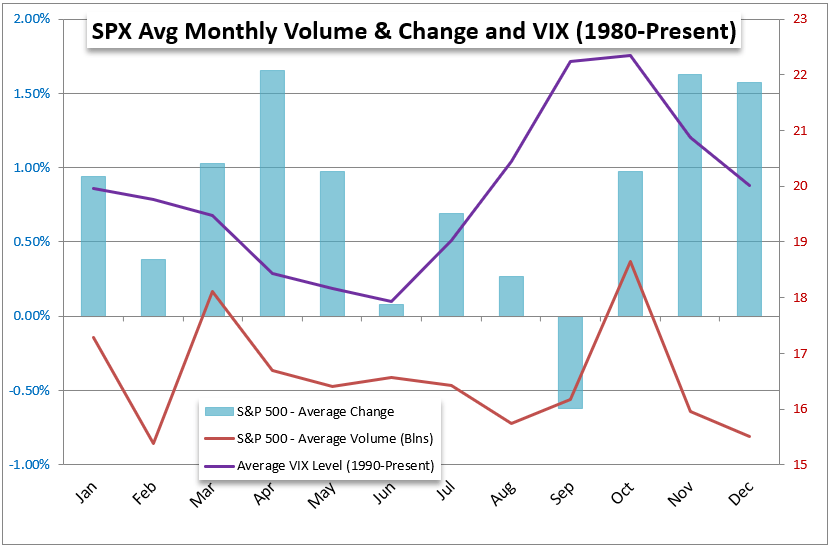
Chart Created by John Kicklighter
VIX and Other Measures of Financial Stability
Moving into the new trading month, it makes sense to keep close tabs on the fundamental course of risk benchmarks through monetary policy and growth measures, but my concerns are running increasingly towards the core functioning of the financial system. Over the past decade, an inherent dependency has been fostered around the assumption that policy officials – both government and central bank – would step in to correct any troubles the market faced. This dynamic gave birth to the term ‘central bank put’ among other controversial terms. However, the transfer of risk from market participant to government-backed entity was not a sustainable solution long term. And, we are seeing the transition of responsibility unfolding before our eyes. The recognition of a future whereby investors will be saddled with more of the burden of their own choices should be considered a serious recognition, but it doesn’t seem to be showing through in measures of financial pressure. While there are some measures of tension, none of the markets most recognizable gauges of fear seem to be hitting the same levels as the recession fears we are chewing on.
Chart of Adjusted National Financial Conditions Index (Weekly)
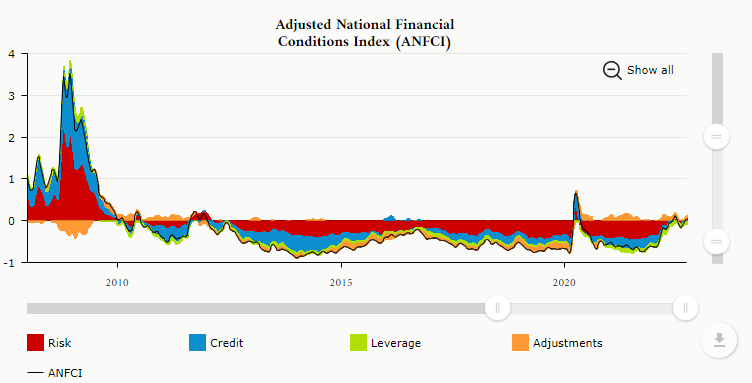
Chart from Chicago Fed Website
When it comes to a financial system that has transitioned to fear in the underlying stability of the financial system, the will be no missing the progress of fallout measured by any number of risk-leaning assets. However, the measures of core liquidity will be my greater gauge of full-scale trouble moving forward. Participation can register some of the most important insights into the overall market’s capacity, but that gauge can be somewhat difficult to access. Far more common I trading circles is the favorite volatility measure in the VIX index. The benchmark activity measure closed above 31 this past week, but it is showing little in the way of instability usually indicative of a surge in the activity measures from extreme congestion towards the 50 handle in short order. That said, the 4-week historical average of the VIX hit its lowest level since the beginning of January 2018. Be wary of the implications.
Chart of VIX Volatility Index with 20-Month SMA, 4-Month Historical Range (Monthly)
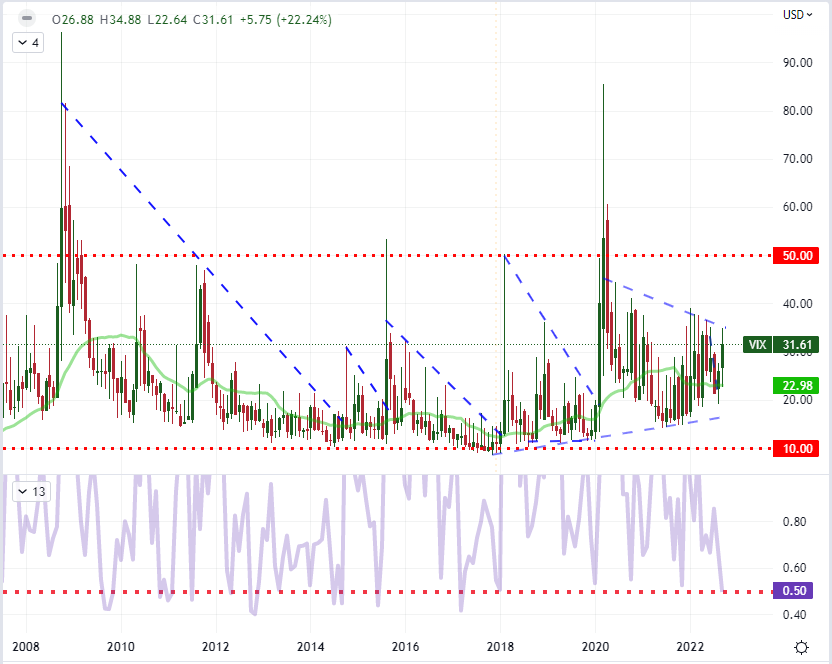
Chart Created on Tradingview Platform
Top Event Risk Including NFPs, USDJPY Is the Most Potential Laden Cross
In scoping the minefield of scheduled event risk over the coming week, there are plenty of high profile listings for major economies. At the beginning of the week, the BOJ’s Summary of Opinions will be taken in the context of its increasingly divergent extreme monetary policy position. In direct contrast to this proposition, the Reserve Bank of Australia and New Zealand are due to announce sizable interest rate hikes. That said the Federal Reserve’s position will continue to exert an exaggerated influence across the financial system. That said, there is little around Fed intention on the docket ahead, but that doesn’t dampen the back up influence from event risk like the ISM manufacturing survey due Wednesday.
Critical Macro Event Risk on Global Economic Calendar for the Next 24 Hours
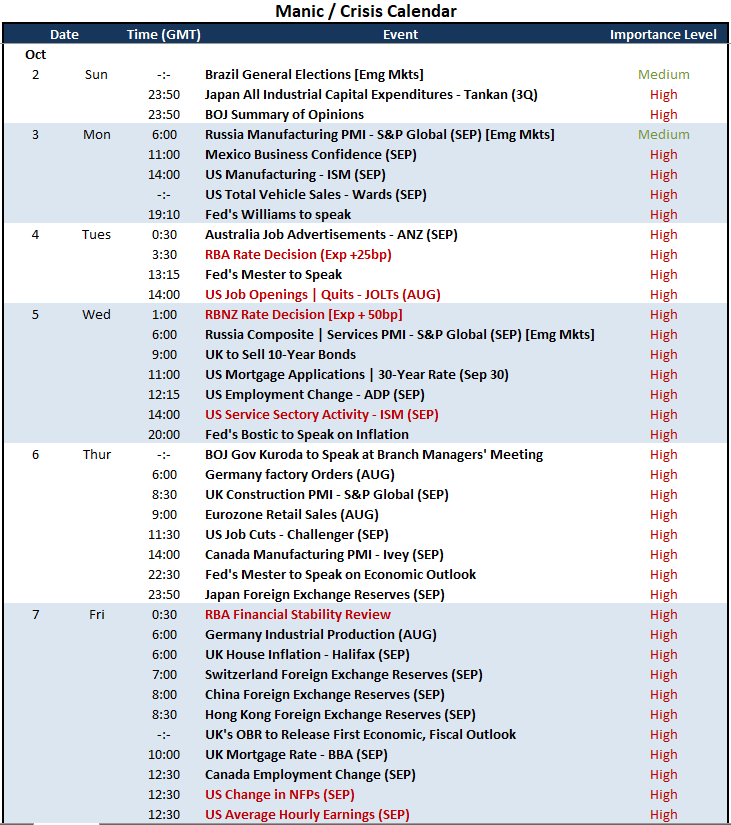
Calendar Created by John Kicklighter
Between an imbalanced stimulus backdrop and risk appetite, USDJPY’s proximity to 1998 highs can unexpectedly act as a gravity sink towards further gains on so prosaic a matter as interest rate differentials. There is little probability that a divergent carry trade opportunity will override more systemic matters have come to light these past weeks and months. When it comes to this cross, however, there is a remarkable reticence to climb above 145 and there is plenty in the way of tempestuous discussion that will ultimately leave the Sterling on a firm footing. I do expect a USDJPY inbreak in the near future, but follow through will depend on the calalyst.
Chart of USDJPY (Daily)
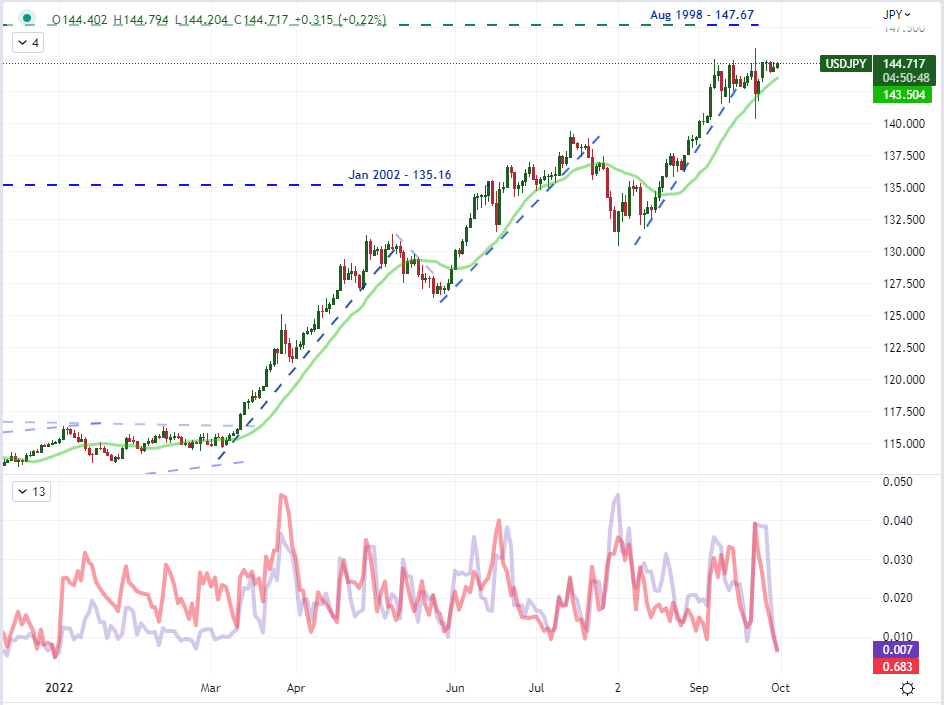
Chart Created on Tradingview Platform
{{NEWSLETTER}}


