


S&P 500 News and Analysis
- Is extreme greed setting in as the Fed warns of upside risks to inflation?
- S&P 500 continues advance after shaky FOMC price action
- The analysis in this article makes use of chart patterns and key support and resistance levels. For more information visit our comprehensive education library

Is Extreme Greed Setting in as the Fed Warns of Upside Risks to Inflation?
When looking at the VIX index, otherwise known as the fear gauge, market participants expressed more concern ahead of this week’s CPI report than they did ahead of the FOMC rate meeting. The lack of market concern simply added to existing bullish S&P 500 momentum in the wake of the Fed’s decision to hold rates steady for now. Core CPI had proven a challenge for the Fed but Tuesday’s data revealed a welcomed move below 5.5% - a level that had prevented progress on the disinflation front.
Easing inflation bolsters stocks as the implication is that the Fed will not need to hike interest rates as aggressively to keep inflation in check. However, a number of data points within the Fed’s summary of economic projections provided reasons for equity valuations to ease. For example, higher expected core PCE (inflation) and a higher view of the peak in interest rates often sees the dollar and US yields move higher while equities typically ease off. This did not transpire. Instead, markets chose to look to the upward revision of real GDP growth and lower revision in the unemployment rate by year end as signs that the US economy is still moving ahead at a respectable rate.
The CNN Fear and Greed Index provides a contrarian view to market sentiment, expressing caution when markets chase extreme returns. The index has moved even further into extreme greed territory, suggesting now may not be the time to chase this market.
CNN Fear and Greed Index
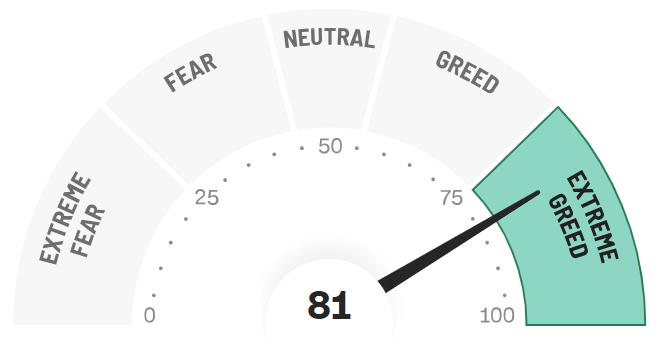
Source: CNN Fear and Greed Index
S&P 500 Technical Analysis: S&P 500 Continues Advance After Shaky FOMC Price Action
Yesterday’s FOMC revelations initially had the index heading lower before bulls rejected the notion of a pullback. Ultimately prices closed near flat but today, thus far, there appears to be renewed bullish direction.
The prior gap above 4325 has not looked back as the next level of resistance appears at 4510. Indications that this market is overheating are flashing red – most notably the RSI which has the index well above overbought territory. That being said, there appears to be no momentum lost as the MACD line and signal line diverge even further from each other. 4311 appears as the nearest level of support (68% Fib retracement of the 2022 sell-off).
S&P 500 E-Mini Futures Daily Chart
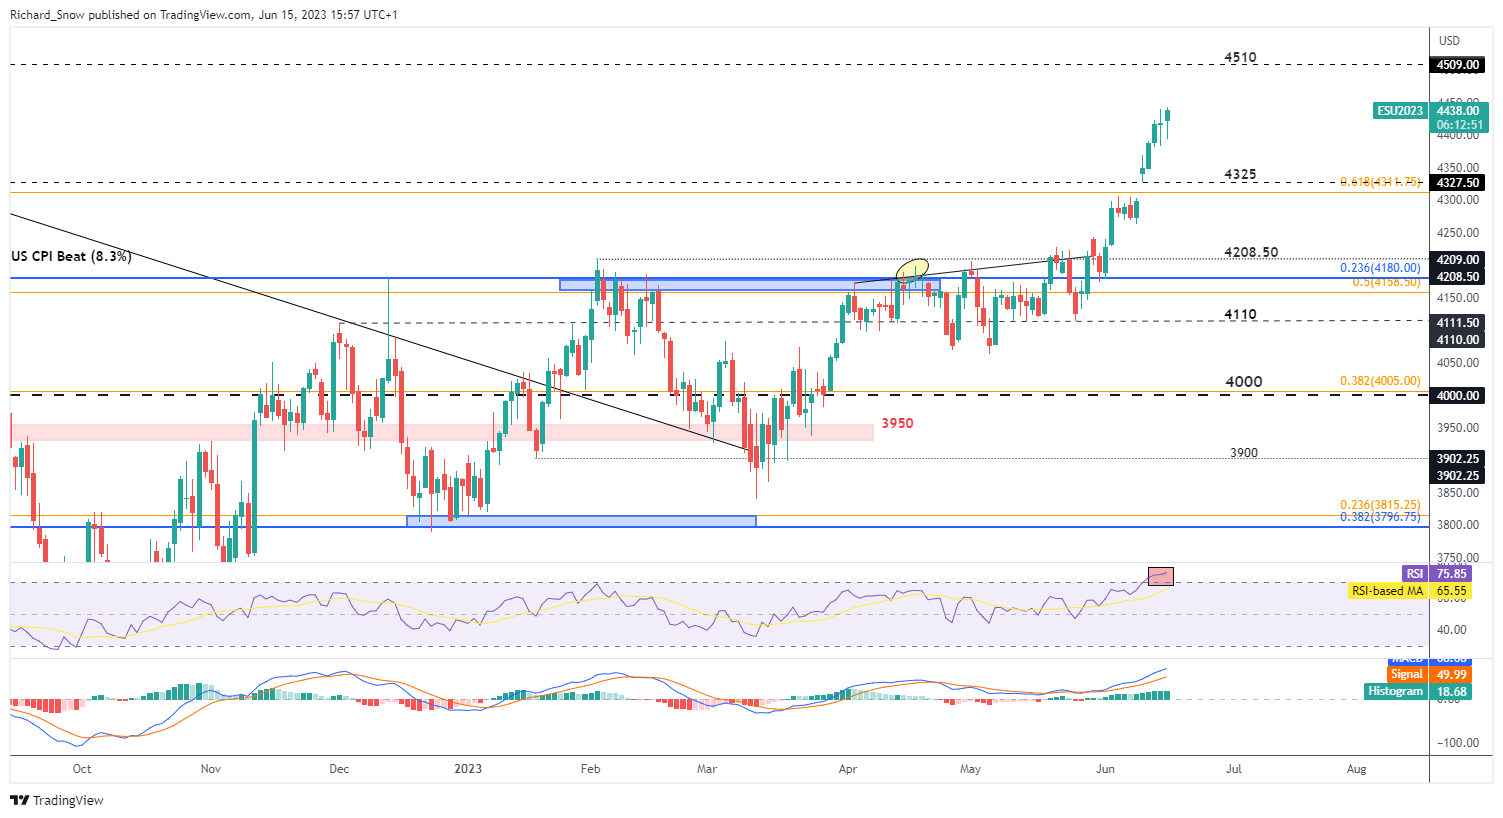
Source: TradingView, prepared by Richard Snow
The weekly chart helps identify longer-term levels of importance with the zone around 4550 now in view. The zone comprises of the 78.6% Fibonacci retracement of the major 2022 decline at 4528 with the August 2021 high of 4550 adding to upside resistance.
S&P 500 E-Mini Futures Weekly Chart
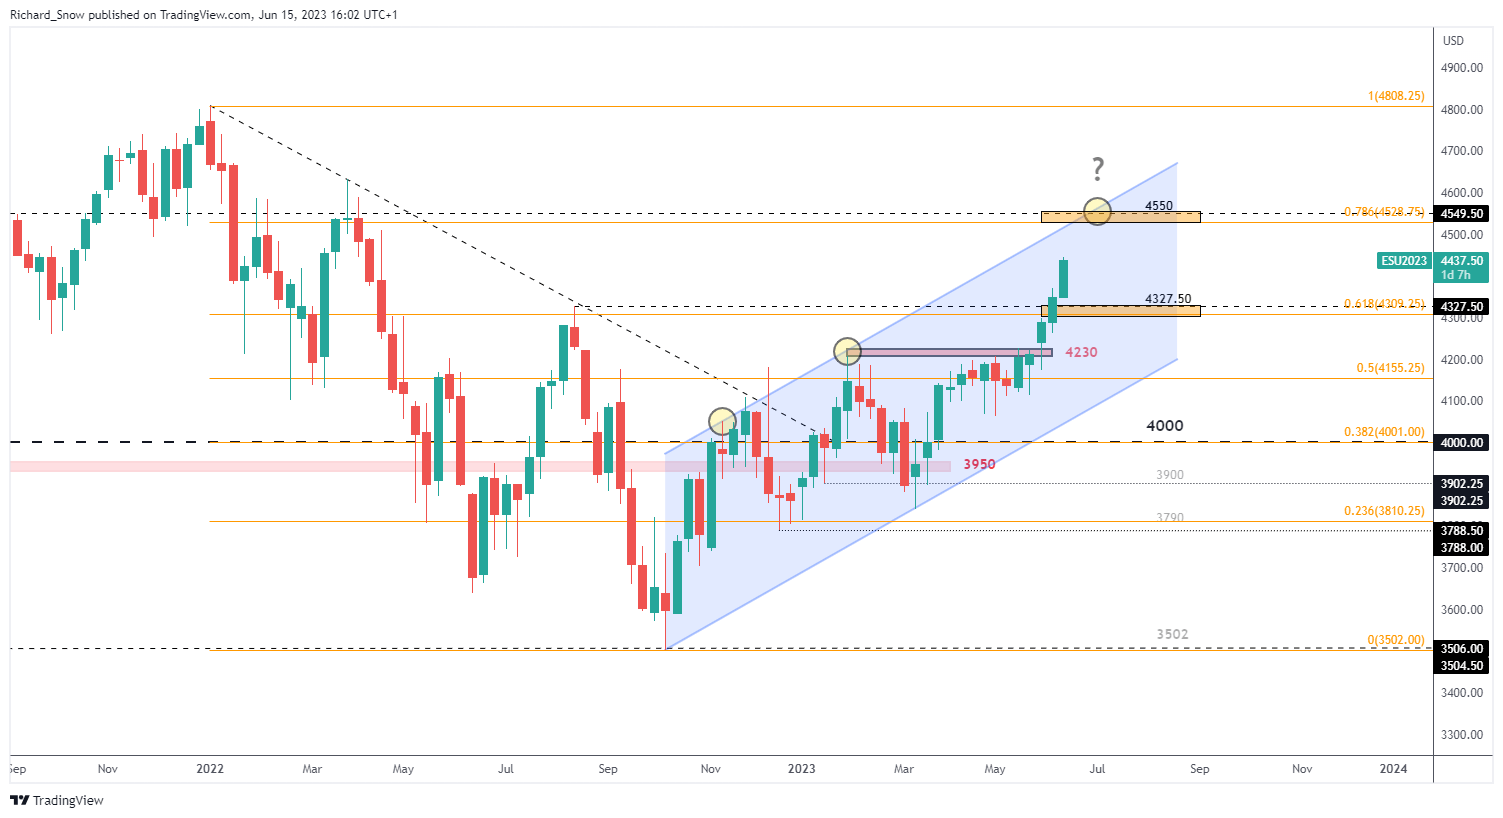
Source: TradingView, prepared by Richard Snow
Trade Smarter - Sign up for the DailyFX Newsletter
Receive timely and compelling market commentary from the DailyFX team
--- Written by Richard Snow for DailyFX.com
Contact and follow Richard on Twitter: @RichardSnowFX


