


US Equities Technical Forecast:
- S&P 500, Nasdaq 100, Dow Jones sank on bank sector woes
- From a technical standpoint, the outlook appears more bearish
- Breakouts under key chart patterns were observed, eyes on support

S&P 500 Outlook - Bearish
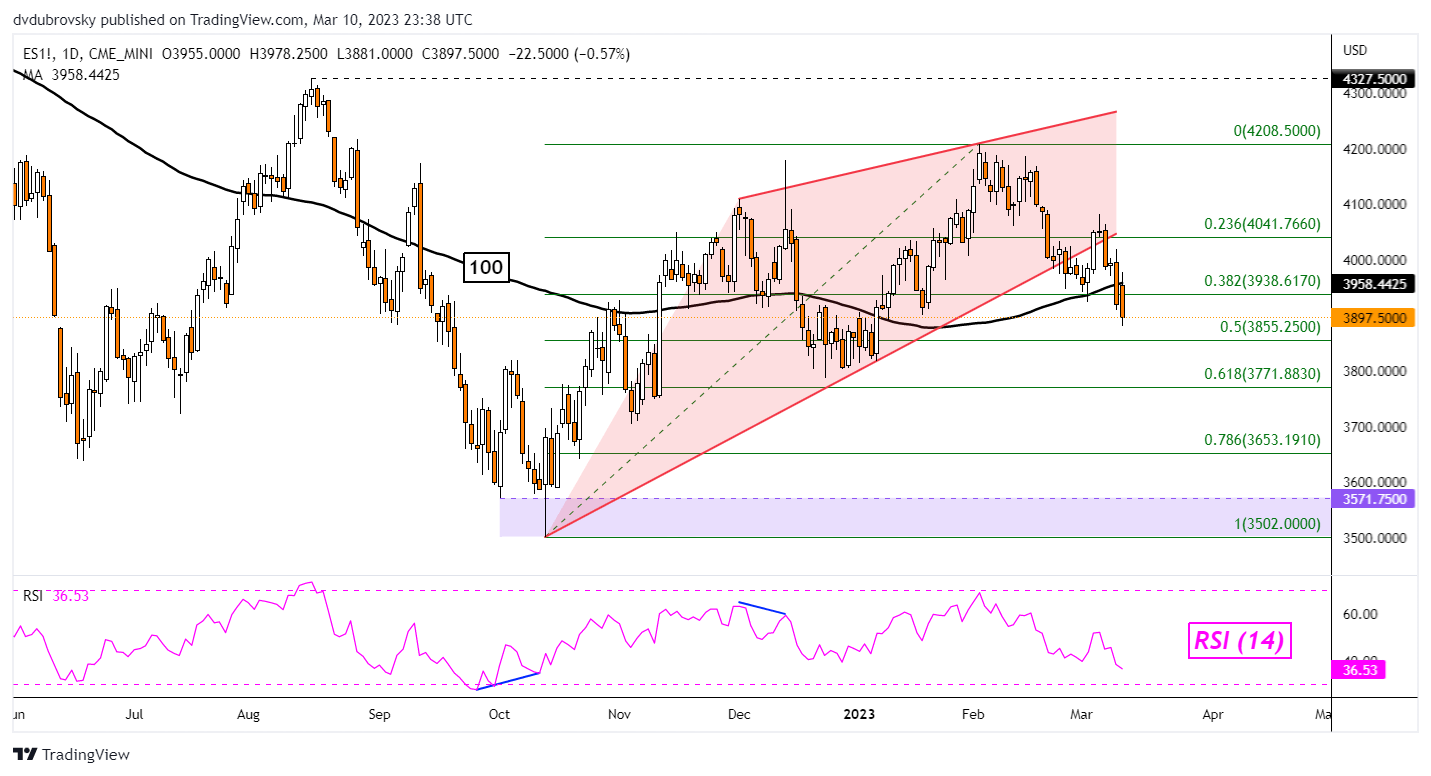
The S&P 500 plunged 3.76% last week, marking the worst 5-day performance since the middle of September. Fundamentally speaking, bank sector contagion woes were a key factor as investors scrutinized the capital health of SVB Financial and crypto-focused bank Silvergate Capital Corp. From a technical standpoint, it seems Wall Street could be setting up for a rough week ahead.
On the daily chart, the S&P 500 confirmed a breakout under the 100-day Simple Moving Average (SMA) as well as a bearish Rising Wedge chart formation. This is opening the door to extending losses. Immediate support is the midpoint of the Fibonacci retracement level at 3855 before the 61.8% point at 3771 appears towards the 3502 – 3653 zone. In the event of a turn higher, key resistance seems to be the 23.6% level at 4041.
Nasdaq 100 Outlook - Bearish
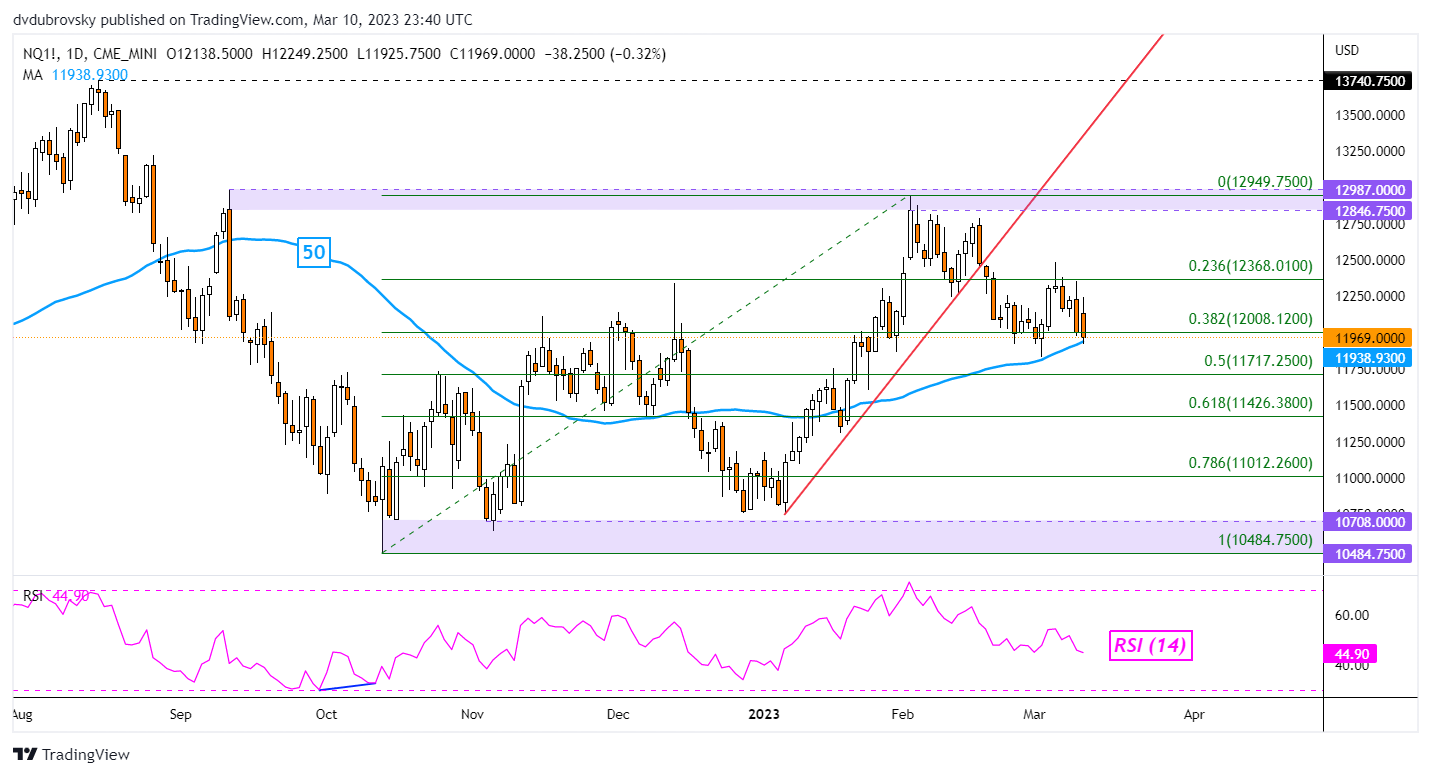
The tech-heavy Nasdaq 100 fell 2.78% last week. Compared to the S&P 500 and Dow Jones, it fared better. But that is hardly surprising given what a less-hawkish Federal Reserve could mean for the tech sector. From a technical standpoint, the breakout under the near-term rising trendline from January remains a bearish threat.
Immediate support seems to be the 50-day SMA followed by the midpoint of the Fibonacci retracement at 11717. Breaking under would open the door to an increasingly bearish outlook. That would expose the 61.8% and 78.6% levels at 11426 and 11012, respectively. Otherwise, a turn higher places the focus on the 23.6% level at 12368 before the 12846 – 12987 zone.
Trade Smarter - Sign up for the DailyFX Newsletter
Receive timely and compelling market commentary from the DailyFX team
Dow Jones Outlook - Bearish
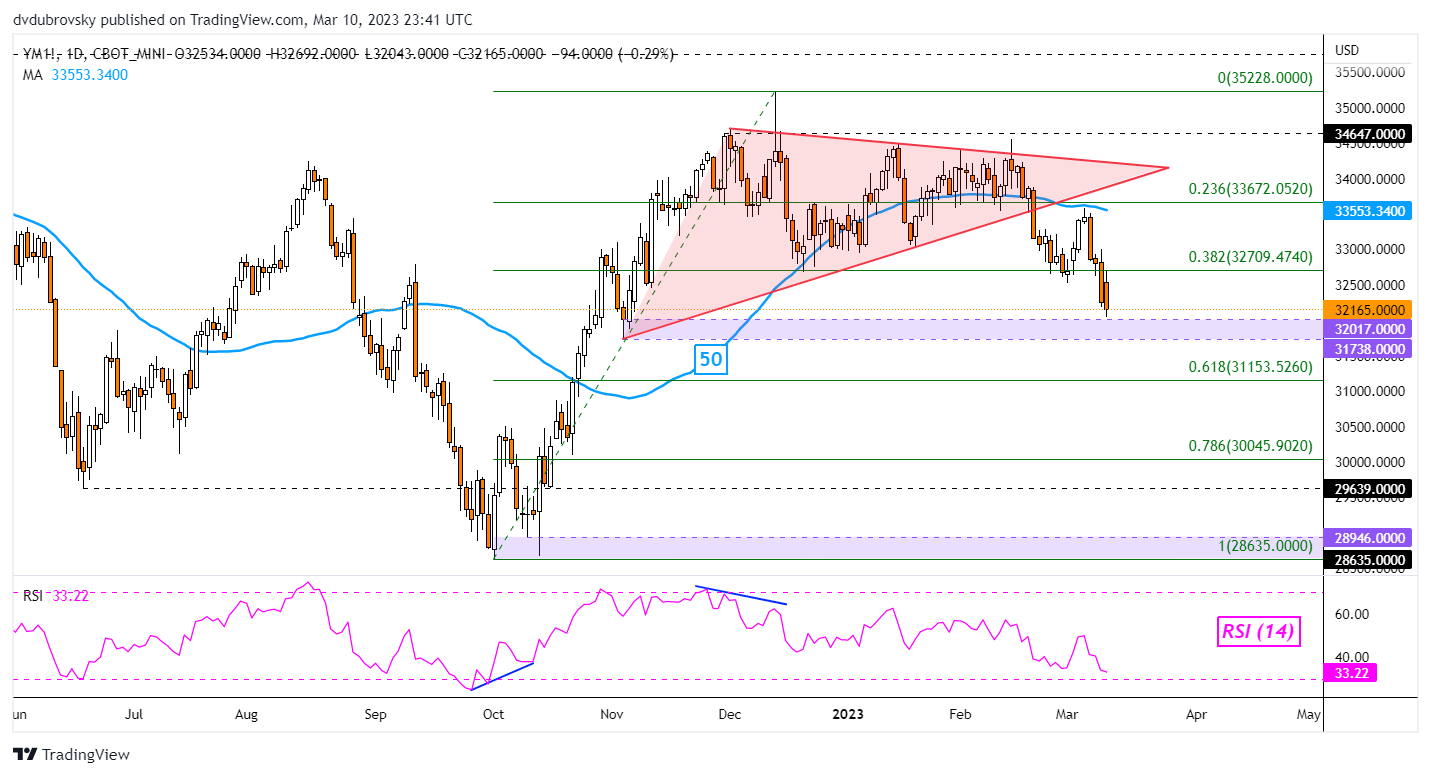
The Dow Jones sank 3.74% last week which was the worst 5-day drop since the middle of September. Prices further confirmed the breakout under a bearish Rising Wedge as the 50-day SMA held as key resistance. Now, immediate support is the 31738 – 32017 range. Breaking lower exposes the 61.8% Fibonacci retracement level at 31153 before the 78.6% point at 30045 kicks in.
--- Written by Daniel Dubrovsky, Senior Strategist for DailyFX.com
To contact Daniel, follow him on Twitter:@ddubrovskyFX


