


US Stock Market Key Points:
- TheS&P 500, Dow and Nasdaq 100 quiver despite third-quarter corporate earnings resilience
- US Treasury yields hit levels not seen since 2007 amid hawkish remarks by Fed officials
- Apple, Alphabet, Amazon to report earnings next week

Most Read: British Pound Technical Analysis: GBP/USD, GBP/JPY, EUR/GBP
The major U.S. stock indices wobbled on Thursday as investors weighed positive corporate earnings against signs that U.S. economy is rapidly slowing amid tightening financial conditions. The third quarter reporting period is off to a good start despite previous concerns that inflation and rising interest rates would have a detrimental impact on financial results. So far, most companies have announced better-than-anticipated numbers, with banks, airlines and some tech firms delivering a healthy performance.
While earnings and forward-guidance have been constructive in most cases, headwinds have not dissipated. On this front, U.S. Treasury yields have continued to trend upwards in recent days on hawkish repricing of FOMC policy. In fact, the 10-year note rose to 4.23% this afternoon, its highest level since 2008 after Fed officials noted that interest rates will rise “well above” 4% this year due to stubbornly elevated core inflation and tight labor markets.
At the close, the Dow and the S&P 500 posted losses of 0.30% and 0.80% respectively though several key companies bucked the trend. For instance, AT&T and IBM staged a solid rally after announcing outstanding third quarter results. AT&T ended with a gain of 7.72% and 4.72% for IBM.
As for the Nasdaq, yesterday’s news that Tesla will miss its target for vehicle deliveries this year also weighed negatively on the tech heavy index. At the close, Tesla lost 6.64% and the index fell 0.51%.
TECHNICAL OUTLOOK
From a technical standpoint, the S&P 500 opened with a gap to the downside on Thursday but gained ground at the open in response to events outside the United States. The resignation of British Prime Minister Truss led to a brief pullback in yields, providing some support for an unconvinced market. Despite these intra-session moves; the underlying picture remains bearish for stocks as higher rates should create a hostile environment for risk assets. Looking at the daily chart, initial resistance appears around 3,805, an area defined by the October’s high and the 38.2% Fibonacci retracement of the 2022 sell-off. On the downside, support may be found near 3590-3600; a closure below this range might give the bears greater control.
S&P 500 (ES1) Mini Futures Daily Chart
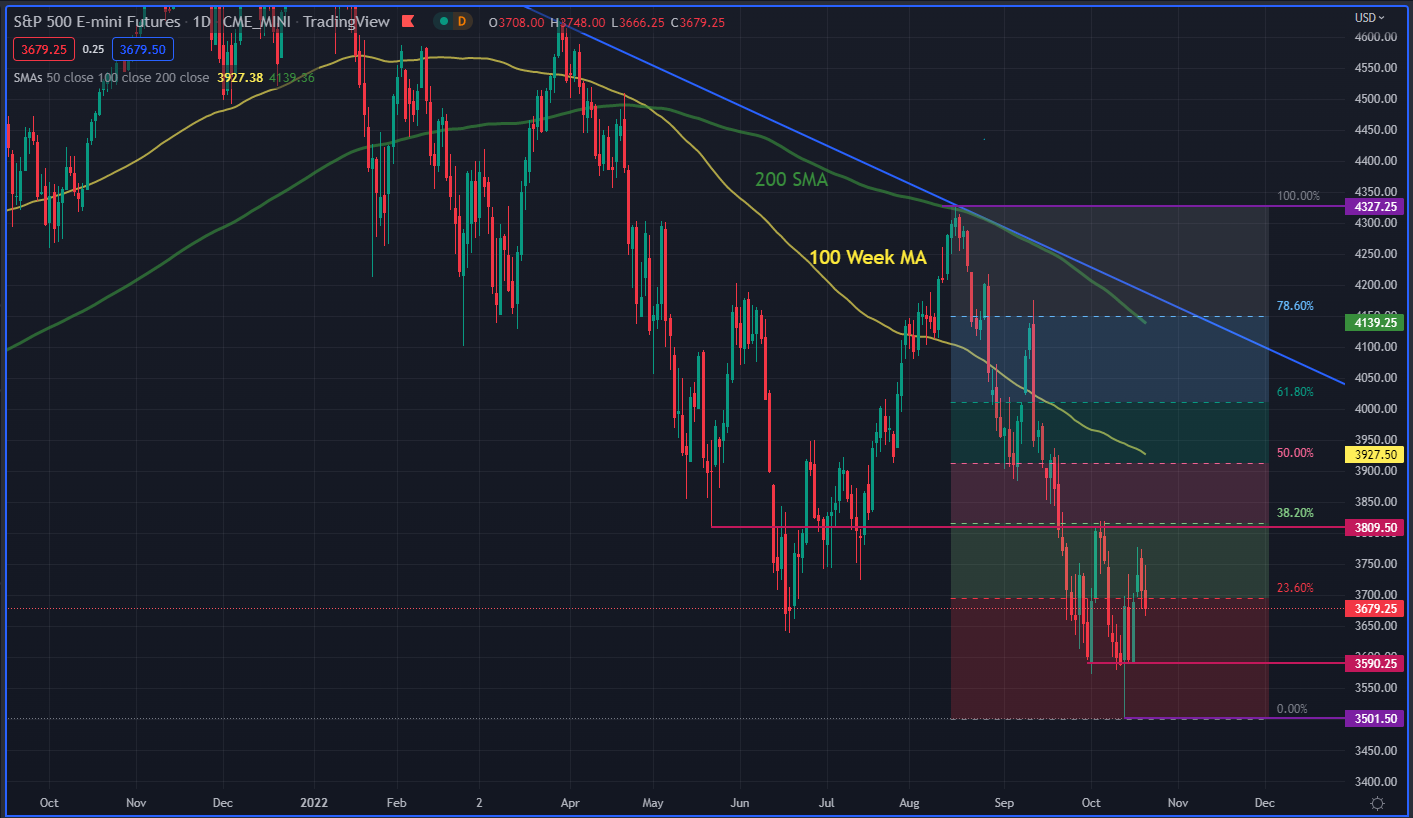
S&P 500 Mini Futures Chart. Prepared UsingTradingView
Looking ahead, according to FactSet, 165 of the 500 companies of the S&P 500 are expected to report earnings next week. Apple, Alphabet and Amazon are included in this list. Similarly, flash PMI, consumer confidence, the advanced GDP price index, durable goods orders, and core PCE will provide an up-to-date assessment of the status of the U.S. economy.
| Change in | Longs | Shorts | OI |
| Daily | -7% | 3% | -2% |
| Weekly | -9% | 0% | -4% |
EDUCATION TOOLS FOR TRADERS
- Are you just getting started? Download thebeginners’ guide for FX traders
- Would you like to know more about your trading personality? Take theDailyFX quizand find out
- IG's client positioning data provides valuable information on market sentiment.Get your free guideon how to use this powerful trading indicator here.
---Written by Cecilia Sanchez-Corona, Research Team, DailyFX


