


FOMC, RBNZ, Interest Rates, NZDUSD Talking Points:
- The Market Perspective: NZDUSD Bearish Below 0.6400
- In the aftermath of the Fed’s, ECB’s, BOE’s and SNB’s 50 basis point rate hikes; there has been a notable increase in the general level of yield
- In the monetary policy spectrum, the RBNZ’s benchmark matches its highest counterparts; but the forecasted peak rate is materially higher

After the deluge of monetary policy activity this week, there remains a remarkable lack of clarity in what currencies were the winners of the substantial uplift in the average developed world benchmark rate. With the Federal Reserve’s, European Central Bank’s and Bank of England’s individual 50 basis point (bp) rate hikes, the yield differential of the most liquid currencies have narrowed. More importantly, the messaging around forecasts has made the average terminal rate – the point at which the central banks will pause from their hike regimes – significantly higher than was previously expected three or six months ago. Technically, after this most recent run of hikes and projections; the Reserve Bank of New Zealand and the New Zealand Dollar has seen the benchmark rate level out. That said, the forecast has continued to move higher through government bond yields and swaps-based forecasts. Through mid-2023, the terminal rate is seen topping 5.57 percent which is a 68bp premium relative to the second highest positioned: the Federal Reserve. And yet, despite that advantage, the Kiwi has wavered with a tentative technical break from NZDUSD.
Relative Monetary Policy Standing of Major Central Banks
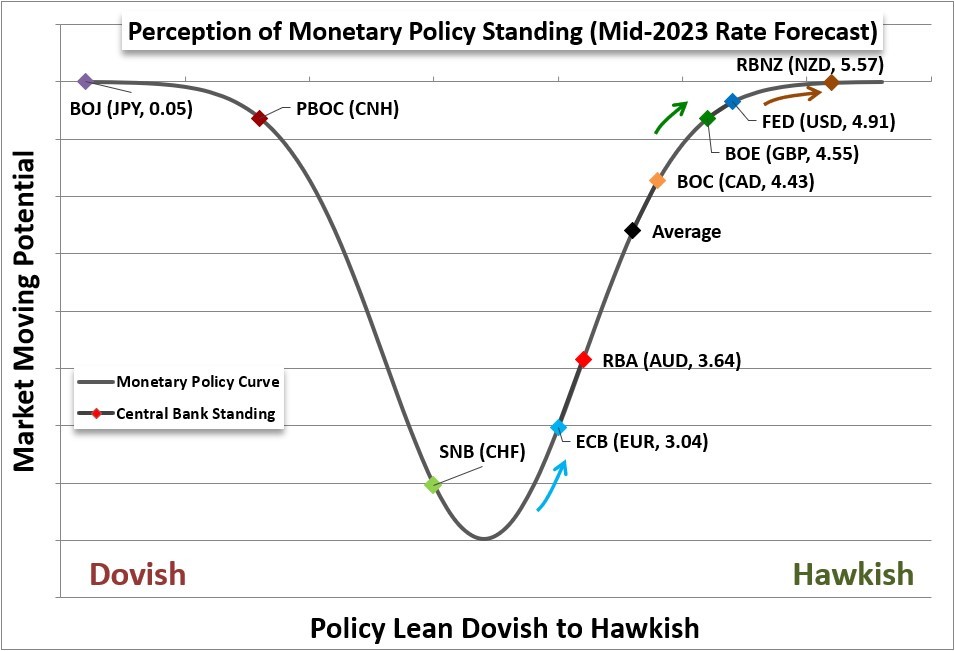
Chart Created by John Kicklighter
While the market rate that the New Zealand Dollar has managed to champion has maintained its premium, that advantage looks increasingly modest as a percentage relative the scale of the rates overall. What’s more, as we could see in the capital markets these past few days, the implications of significantly tighter monetary policy for the global economy in the first half of 2023 has had a deleterious influence on market sentiment. The reversal in the Dow, DAX and FTSE 100 this past session is quite prominent. That combination of mitigating the importance of marginal rate advantages and seeing ‘risk aversion’ seems to have exacted a significant impact on NZDUSD. The pair forged a remarkably consistent and robust trend these past months with spot running as far above the 50-day SMA as anything we’ve seen since May 2009. With the channel break this past session, next support is the 20-day SMA.
Chart of NZDUSD with 20 and 50-Day SMAs, 1-Day ROC and 50-Day Disparity Index (Daily)
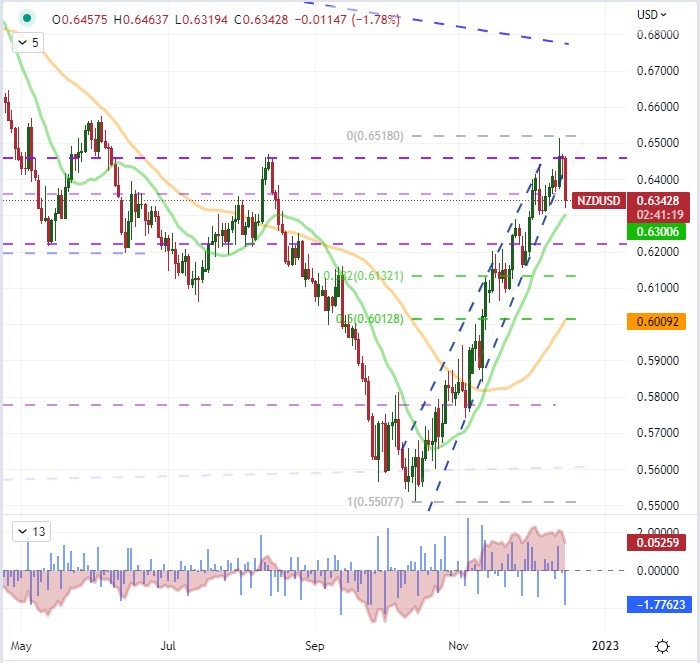
Chart Created on Tradingview Platform
In contrast to NZDUSD, there isn’t as distinct a ‘safe haven’ component in the AUDNZD cross. Nevertheless, the trend the pair has formed since its September 28th reversal is perhaps even more impressive on a technical basis. Here, the primary differentiator seems to be rates and rate expectations. The other elements like ‘sentiment’ connection and growth potential are fairly tightly linked. That said, the RBA’s monetary policy potential seems to be very close to plateauing at a significantly lower rate than its New Zealand counterpart. There is still potential for AUDNZD to reversal on such a high-profile channel, but there is also a strong foundation for bears to keep pushing through the 61.8 percent Fibonacci retracement of the post-pandemic range and the trendline support that began at the March 2020 low and confirmed with tests in September and November 2021.
Chart of AUDNZD with 20 and 50-Day SMAs, 1-Day ROC and 50-Day Disparity Index (Daily)
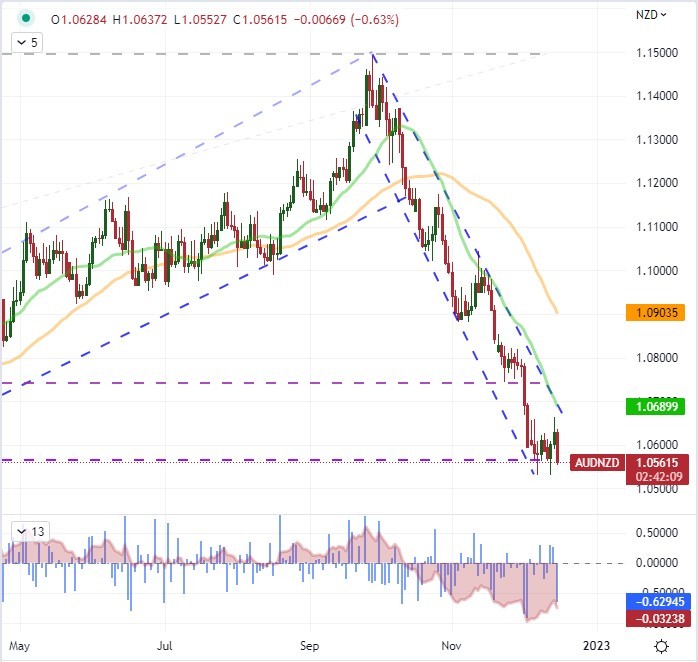
Chart Created on Tradingview Platformd


