


USD/JPY Medium-Term Technical Forecast – NEUTRAL
Developments on the technical charts suggest USD/JPY could settle in a broad range before making an attempt to retest its October 2022 high sometime in the coming months.
USD/JPY is down over 10% from a 32-year high of 151.95 hit in October before consolidating in recent sessions. USD/JPY has retreated from major converged resistance: the 1998 high of 147.65, coinciding with the 200-quarter moving average and the upper edge of a rising channel from 2012. The pair looks set to post a bearish reversal on the quarterly chart (a higher high followed by a lower close compared to the previous quarter). This column had first pointed out the risk of a consolidation/correction in USD/JPY in early November.
USD/JPY Quarterly Chart
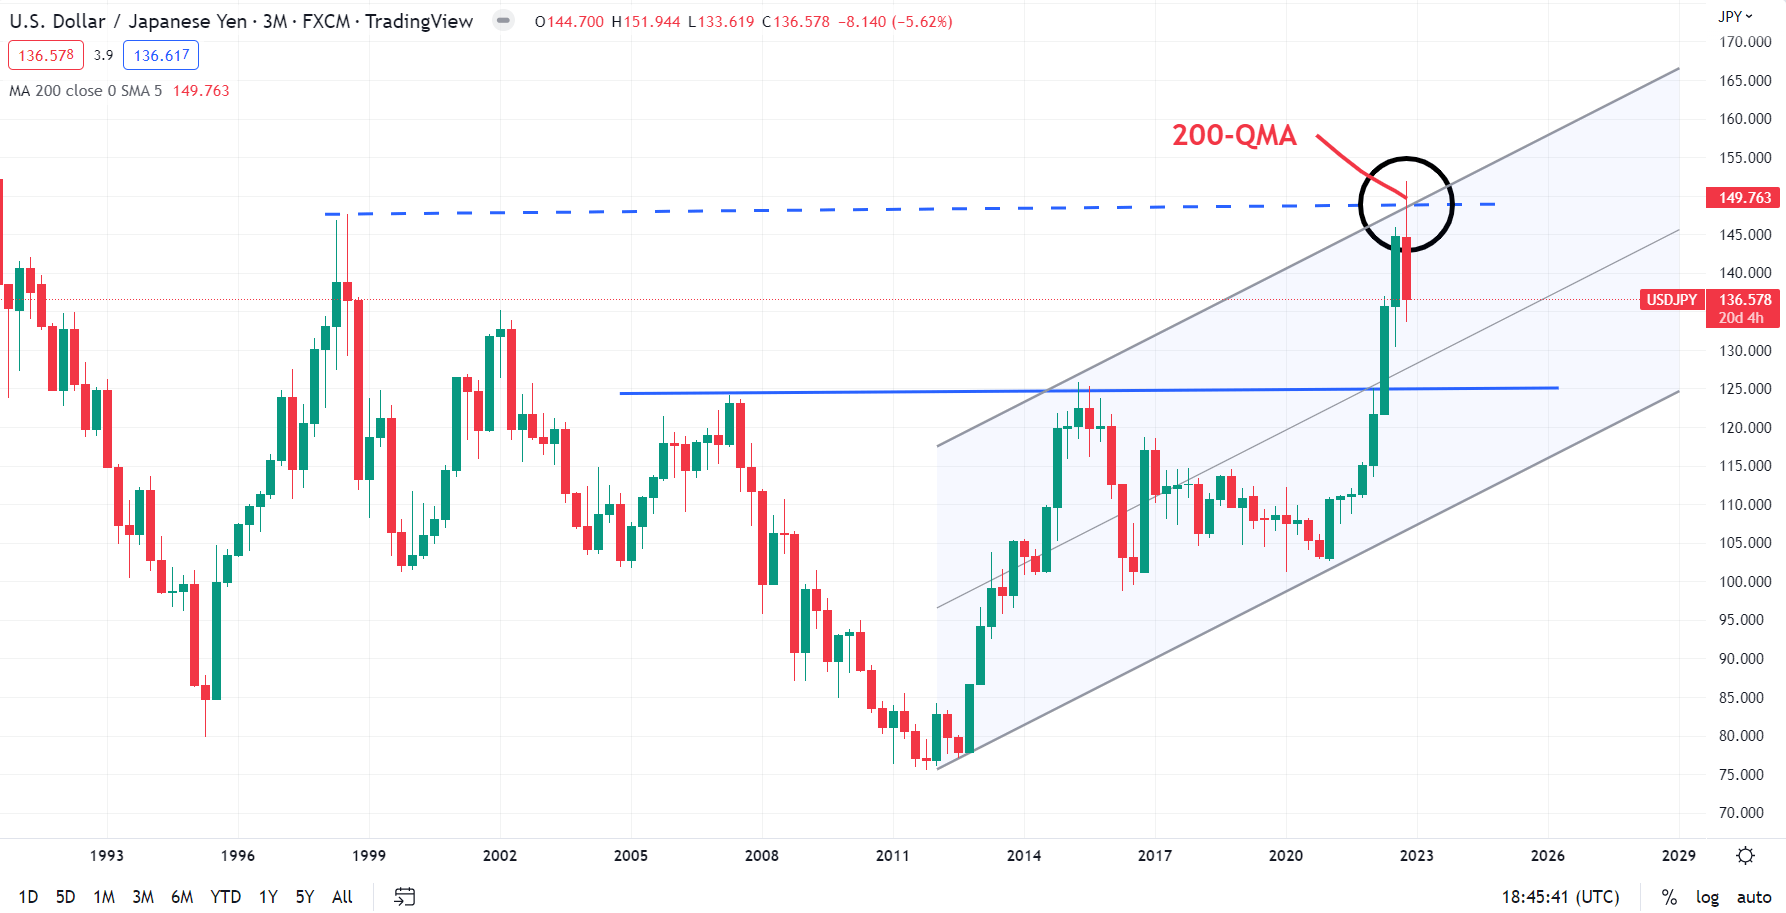
Source: TradingView
Going forward, further downside could be limited. The pair is holding above fairly strong support on the 200-day moving average, not too far from the May low of 130.40 and the 89-week moving average. The shorter moving average turned into a floor in 2021 after serving as a strong ceiling for the pair in 2018 and 2020.
Even if USD/JPY finds a base, it may be premature to assume imminent (up) trending conditions prevalent since 2021 until late 2022. As the monthly chart shows, the Moving Average Convergence Divergence (MACD) on the weekly chart is pointed downward, though still in positive territory, indicating that the medium-term uptrend has faded in the interim. However, the overall trend remains up as MACD is above zero on the weekly and higher timeframe charts.
USD/JPY Weekly Chart
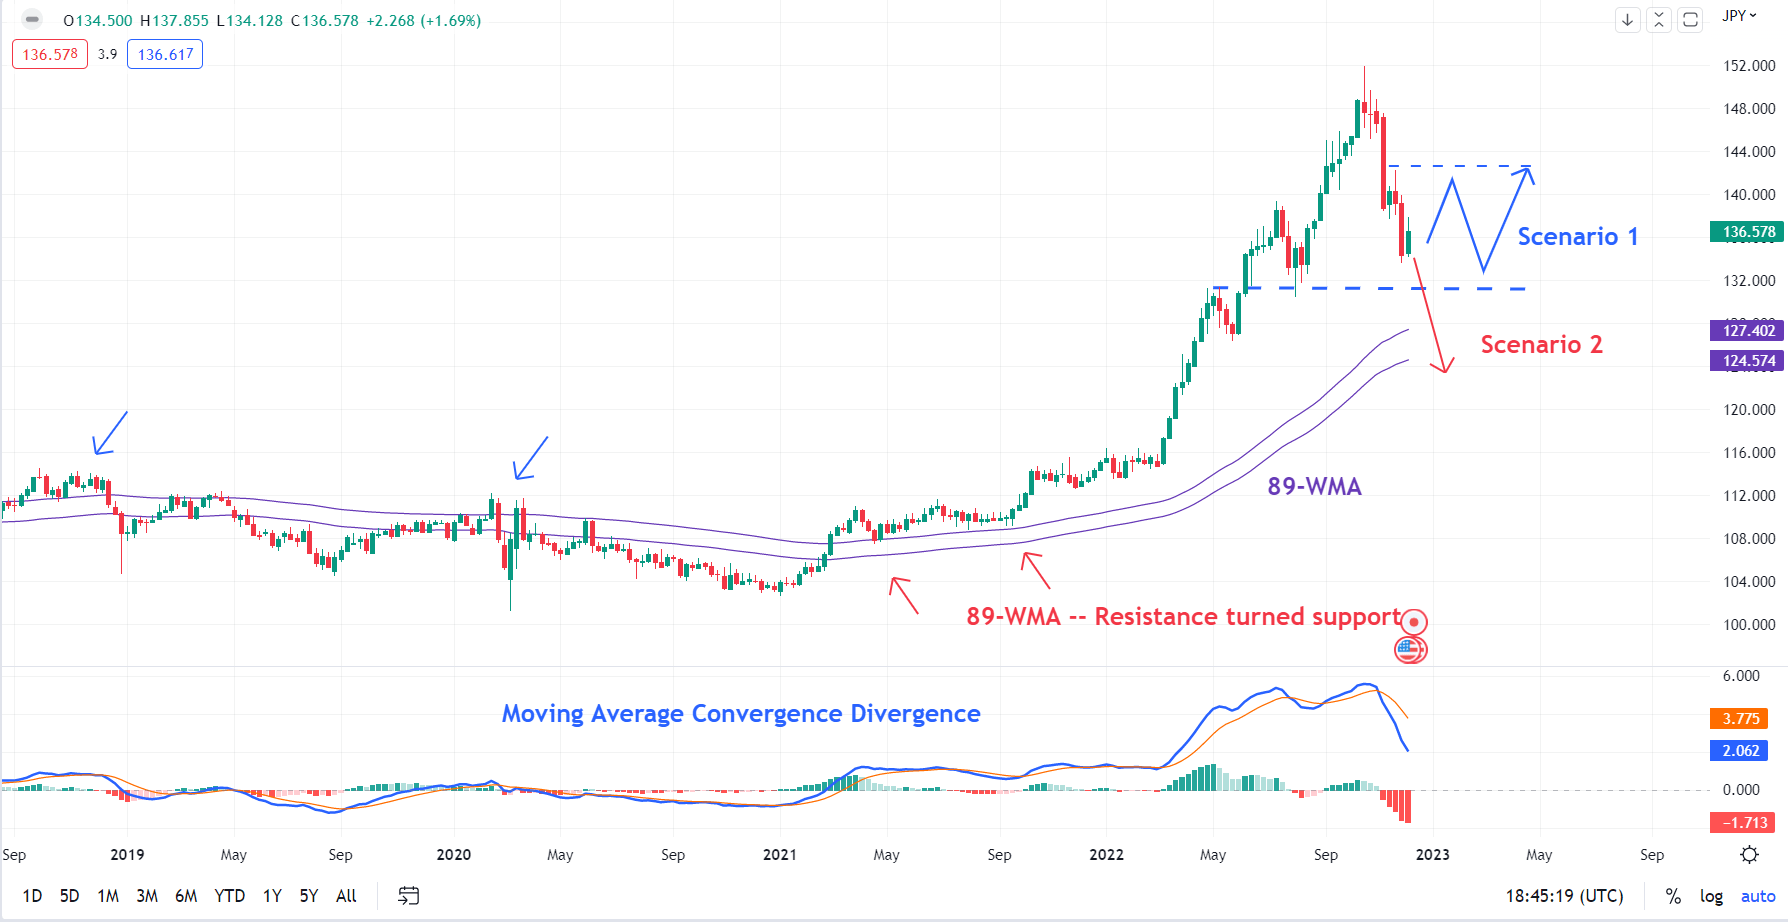
Source: TradingView
Put together, USD/JPY could settle in a 132-142 range over the coming weeks, with a good chance of a retest of the early November high of 148.80, possibly the October high of 151.95.
An alternate scenario, a low probability one, is bearish. In this scenario, a break below the 200-day moving average could pave way toward the 2007 and 2015 highs of 124-125. Such a drop would meaningfully raise the odds that the multi-month uptrend was beginning to reverse.


