


Gold Price (XAU/USD), Chart, and Analysis
- Gold bounces off a triple bottom.
- A break above $1,730/oz. turns sentiment positive.

The precious metal rallied through resistance barriers on Tuesday with relative ease as the US dollar slipped on thoughts that the Federal Reserve may pare back December’s rate hike. The latest market pricing now favors a 50bp hike (56.8%) compared to a 75bp increase (43.2%) as Fed speakers begin reining in further, aggressive tightening talk.
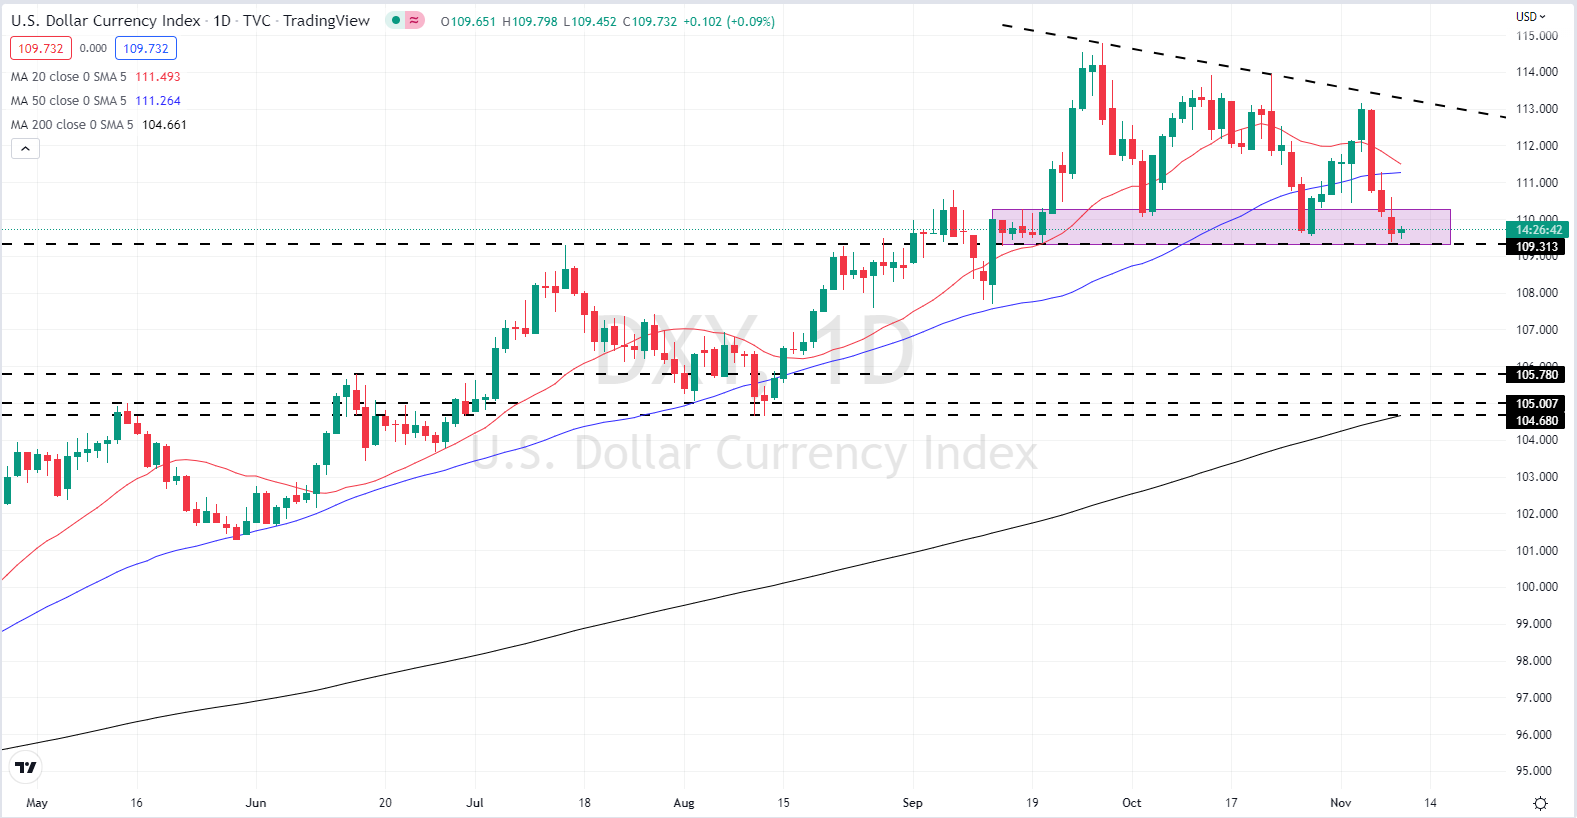
A look at the US dollar daily chart shows the greenback back in a zone of support that has held for the last two months. Since the end of September, the US dollar has failed to break higher with the short-term trend showing a bearish bias. Support remains in place suggesting that the US dollar may become trapped in a narrowing range in the short- to medium term.

US Dollar Currency Index Daily Chart – November 9, 2022
For all market-moving data releases and events, see the DailyFX Economic Calendar.
Trade Smarter - Sign up for the DailyFX Newsletter
Receive timely and compelling market commentary from the DailyFX team
Gold printed a fresh one-month high on Tuesday as the US dollar slipped into support. Gold has added around $100/oz. since last Thursday when the precious metal bounced off support, the third time this level has held in the last six weeks. The daily chart is looking more positive with the multi-month downtrend under pressure. A close and open above $1,730/oz. would break the recent series of lower highs and leave $1,766/oz. as the next upside target. Initial support between $1,676/oz. and $1,682/oz.
Gold Daily Price Chart – November 9, 2022
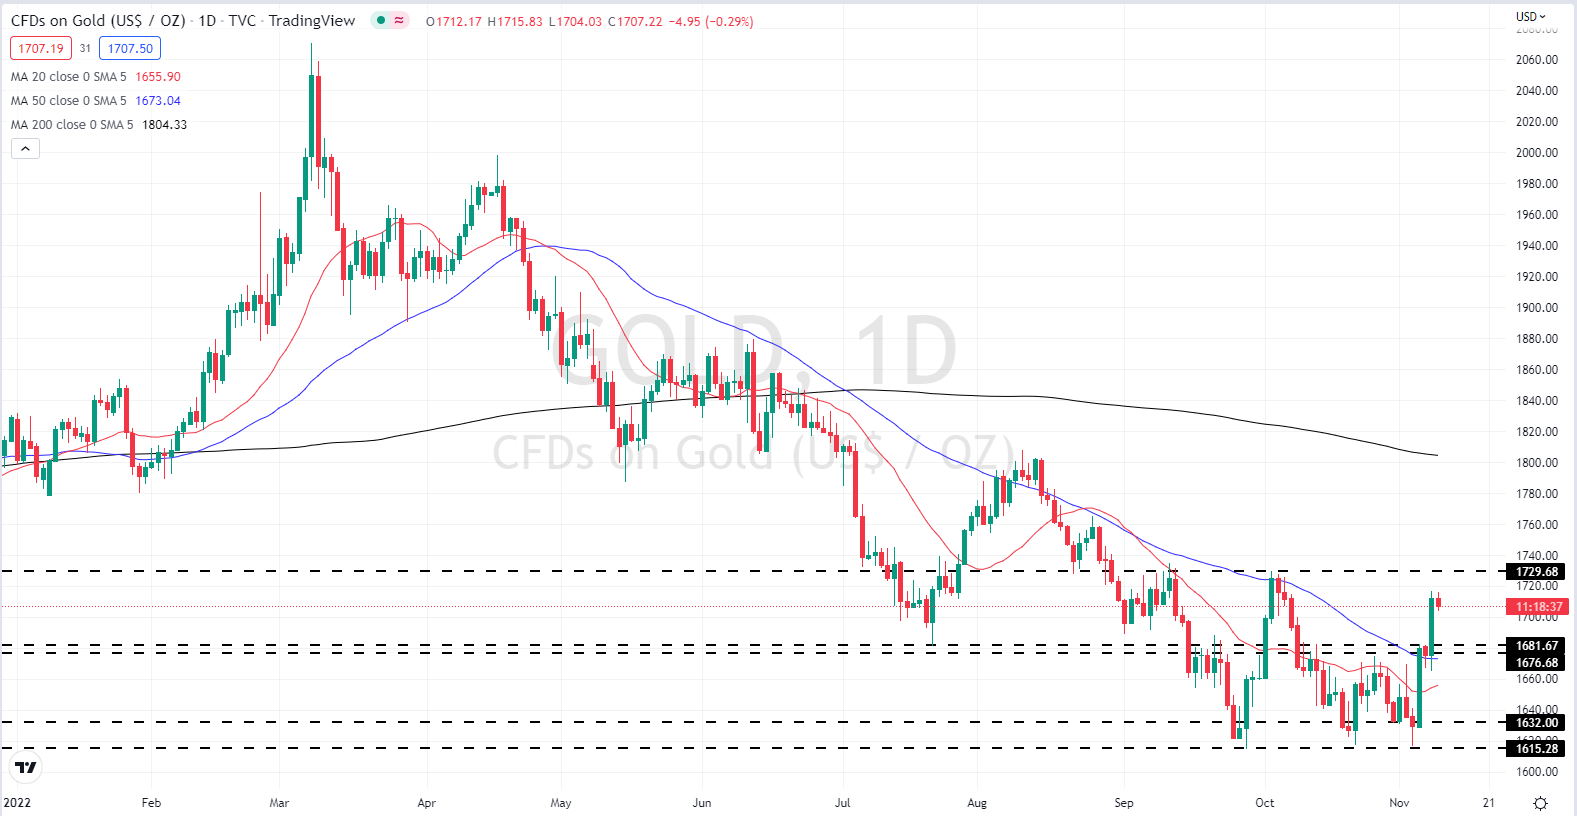
Chart via TradingView
Retail trader data show that 73.58% of traders are net-long with the ratio of traders long to short at 2.79 to 1.The number of traders net-long is 8.71% lower than yesterday and 17.20% lower from last week, while the number of traders net-short is 2.14% higher than yesterday and 47.14% higher from last week.
We typically take a contrarian view to crowd sentiment, and the fact traders are net-long suggests Gold prices may continue to fall. Yet traders are less net-long than yesterday and compared with last week. Recent changes in sentiment warn that the current Gold price trend may soon reverse higher despite the fact traders remain net-long.
Trade Smarter - Sign up for the DailyFX Newsletter
Receive timely and compelling market commentary from the DailyFX team
What is your view on Gold – bullish or bearish?? You can let us know via the form at the end of this piece or you can contact the author via Twitter @nickcawley1.


