


Gold (XAU/USD), Bitcoin (BTC/USD) Analysis and Charts
Q1 2024 Gold Forecast:

- Gold in need of a driver – will US CPI help?
- Bitcoin - a confirmed break of $49k should bring $52k back into play quickly.
A quiet start to what should be a busy week, not helped by most Asian markets being closed for holidays. Chinese markets are closed all week for the Lunar New Year while Hong Kong, Taiwan, and South Korea were also closed today. With little economic data on the calendar today, traders should be mindful of a handful of central banker speeches throughout the day.
For all economic data releases and events see the DailyFX Economic Calendar
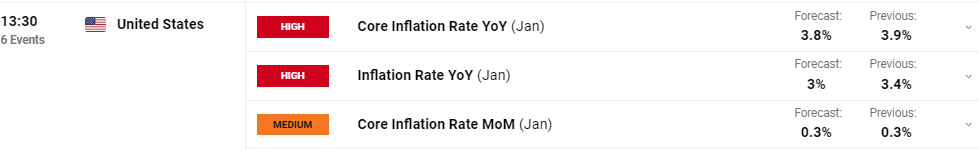
On Tuesday, the US Bureau of Labor Statistics will release the latest inflation data at 13:30 UK. Core inflation y/y (January) is seen falling to 3.8% from 3.9%, while headline inflation is seen falling to 3% from a prior month’s level of 3.4%.
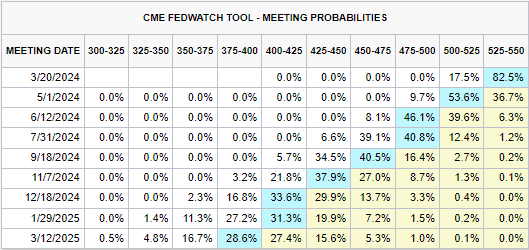
While any easing of US price pressures will be welcomed by the Federal Reserve, it is unlikely to move the dial toward a March rate cut. Current market pricing shows just a 17.5% chance of a 25 basis point rate cut in March.
The daily gold chart shows the current lack of volatility in the precious metal. Gold remains stuck in a narrow trading range with the current 14-day ATR showing a reading of just over $20. Resistance remains around the $2,044/oz. area while support is seen at $2,010/0z. ahead of $2,000/oz. Gold traders will be hoping that Tuesday’s US inflation data will inject some volatility into the precious metal.
Gold Daily Price Chart
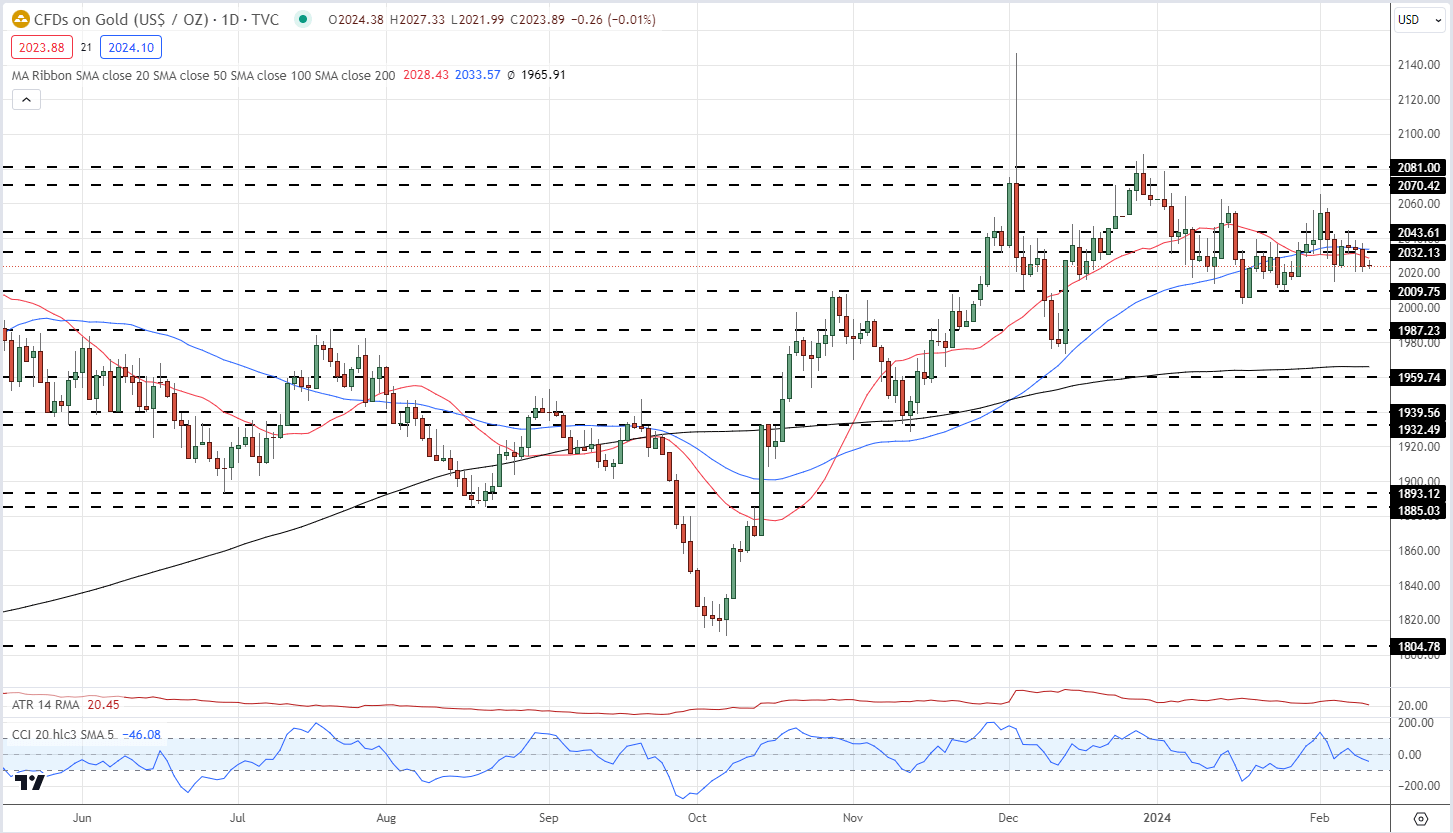
Chart via TradingView
Retail trader data shows 66.31% of traders are net-long with the ratio of traders long to short at 1.97 to 1.The number of traders net-long is 4.41% higher than yesterday and 7.80% higher than last week, while the number of traders net-short is 8.05% higher than yesterday and 2.21% lower than last week.
We typically take a contrarian view to crowd sentiment, and the fact traders are net-long suggests Gold prices may continue to fall.
See how daily and weekly changes in IG Retail Trader data can affect sentiment and price action.
| Change in | Longs | Shorts | OI |
| Daily | 1% | -3% | -1% |
| Weekly | 2% | -8% | -2% |
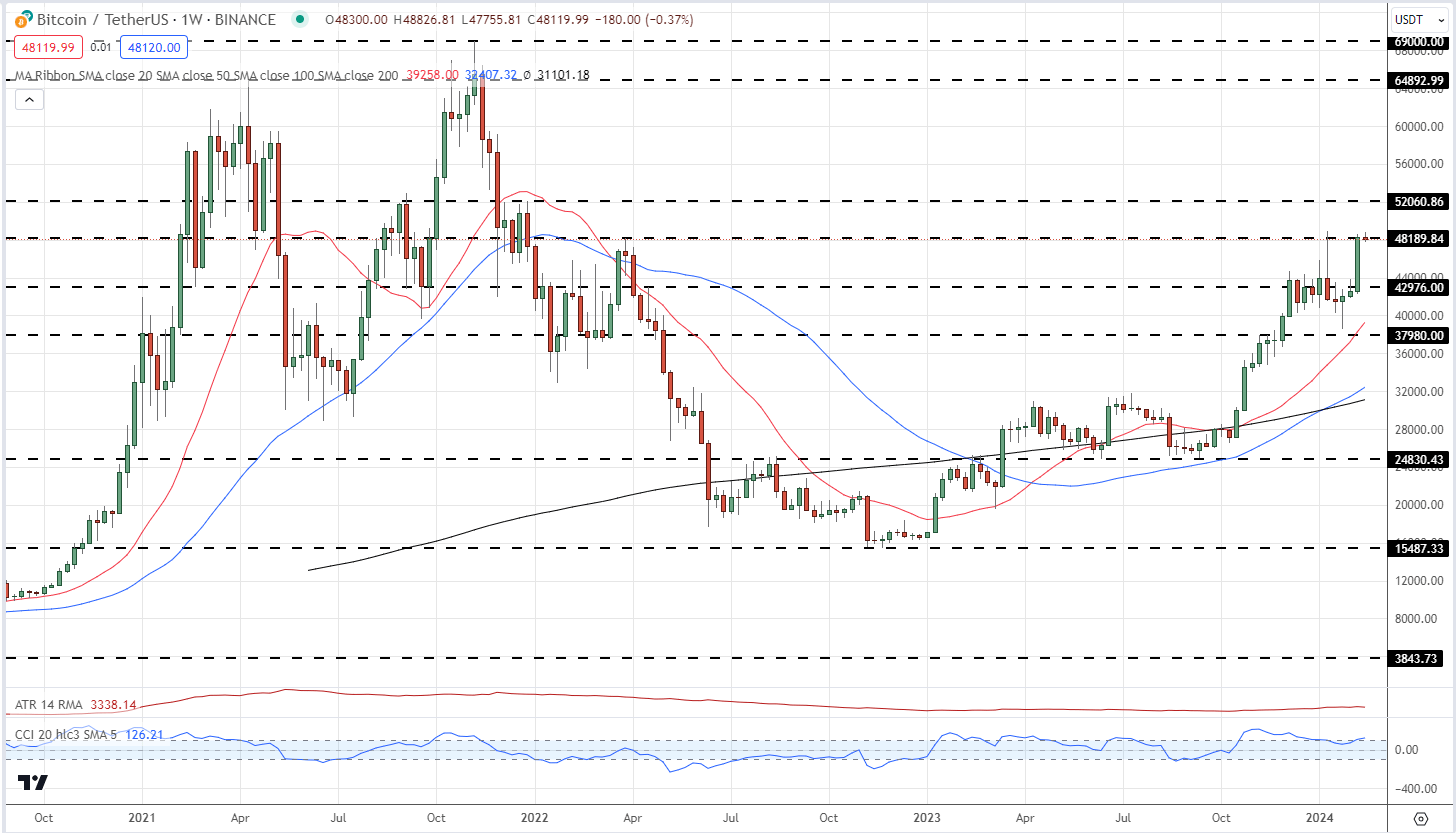
In contrast to gold, Bitcoin traders are enjoying a renewed bout of volatility with the largest cryptocurrency by market capitalization currently eyeing a test on levels last seen in December 2021. The recent post-ETF sell-off and rally has pushed BTC/USD back above $48k with the January 11 high at a fraction under $49k seen as the next target. Above here there is little in the way of resistance on the weekly chart before $52k comes into play.
The latest rally is being driven not just by the successful release of a range of spot Bitcoin ETFs over the last month, but also by the Bitcoin halving event which is expected on April 17. Bitcoin halving is an event, that occurs approximately every four years and is programmed into Bitcoin’s code that cuts miners’ rewards for adding new blocks to the Bitcoin by 50%. This reduction in supply leads to increased scarcity and if demand for Bitcoin remains constant, or increases, drives the price of BTC higher. In 2012 the halving cut BTC mining rewards from 50 BTC to 25 BTC, in 2016 from 25 to 12.5 BTC, in 2020 from 12.5 BTC to 6.25. In next year’s halving – expected in mid-April - the reward for mining a Bitcoin block will be cut to 3.125 BTC.
Bitcoin Weekly Price Chart
What is your view on Gold and Bitcoin – bullish or bearish?? You can let us know via the form at the end of this piece or you can contact the author via Twitter @nickcawley1.


