


Gold and Silver Technical Forecast
- The generally softer US dollar has propelled both gold and silver but silver is the standout of the two metals in terms of its bullish rise
- Gold: Finding tough resistance at the 200 day SMA and psychological 1800 level
- Silver: Trading above a massive zone of support with very few signs of slowing down
- The analysis in this article makes use of chart patterns and key support and resistance levels. For more information visit our comprehensive education library

Gold (XAU/USD) Technical Forecast: Mixed
Gold has put in a phenomenal week of gains on the back of declining US yields and a softer dollar. The precious metal now test the psychological level of 1800 to close out the week. The bullish advance came off the back of a rather strong rejection of the 1611.40 (Jan 2020) level as a third extended lower wick on the weekly time frame proved sufficient to reject a move lower and, in fact, start a move higher.
Gold (XAU/USD) Weekly Chart
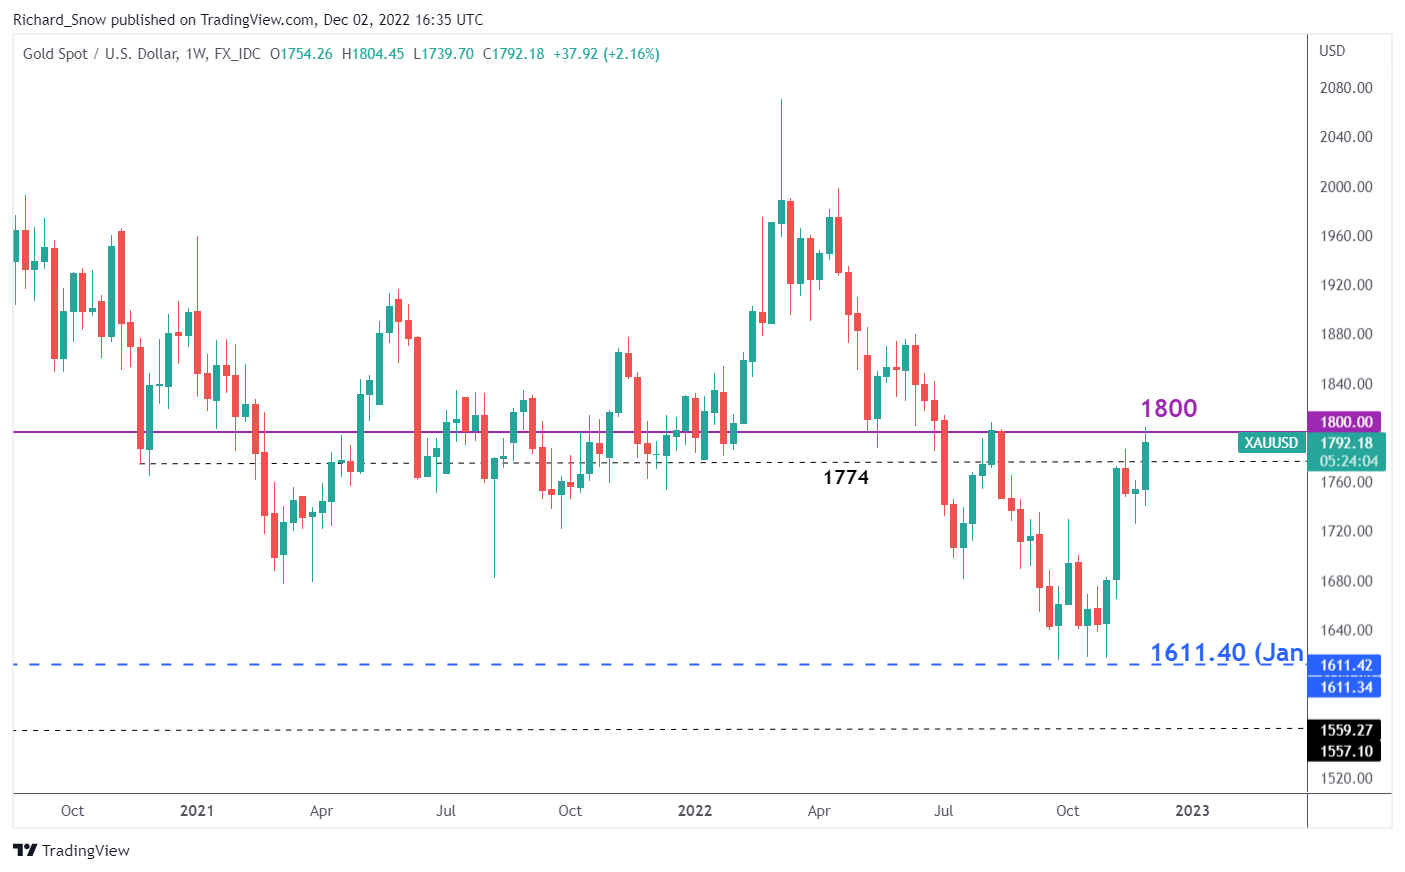
Source: TradingView, prepared by Richard Snow
The daily chart helps to visualize the potential area of resistance to gold’s bullish move. The purple rectangles show previous times when price action approached and ultimately respected the 1800 level. The level had been respected as both support and resistance, further underscoring its importance. Not only that, the 200 day SMA also conveniently rests at the 1800 level, meaning that nothing less than a massive follow through from gold bulls would be likely to succeed in driving prices higher from here.
A pullback towards the 38.2% Fibonacci retracement of the 2022 major move (1786) remains a possibility should prices cool before launching another attempt at 1800. The Fib level also coincides with the mid-November higher high. The RSI also hints at a potential slowdown from here as it returns from a very brief period in oversold territory.
Gold (XAU/USD) Daily Chart

Source: TradingView, prepared by Richard Snow

Silver (XAG/USD) Technical Forecast: Bullish
While gold shows signs of possible consolidation, silver continues to power ahead unabated. The weekly chart shows how easily the metal pushed above the 21.40-22.10 zone of resistance as silver remains on track for its largest one week rise since July.
Silver (XAG/USD) Weekly Chart
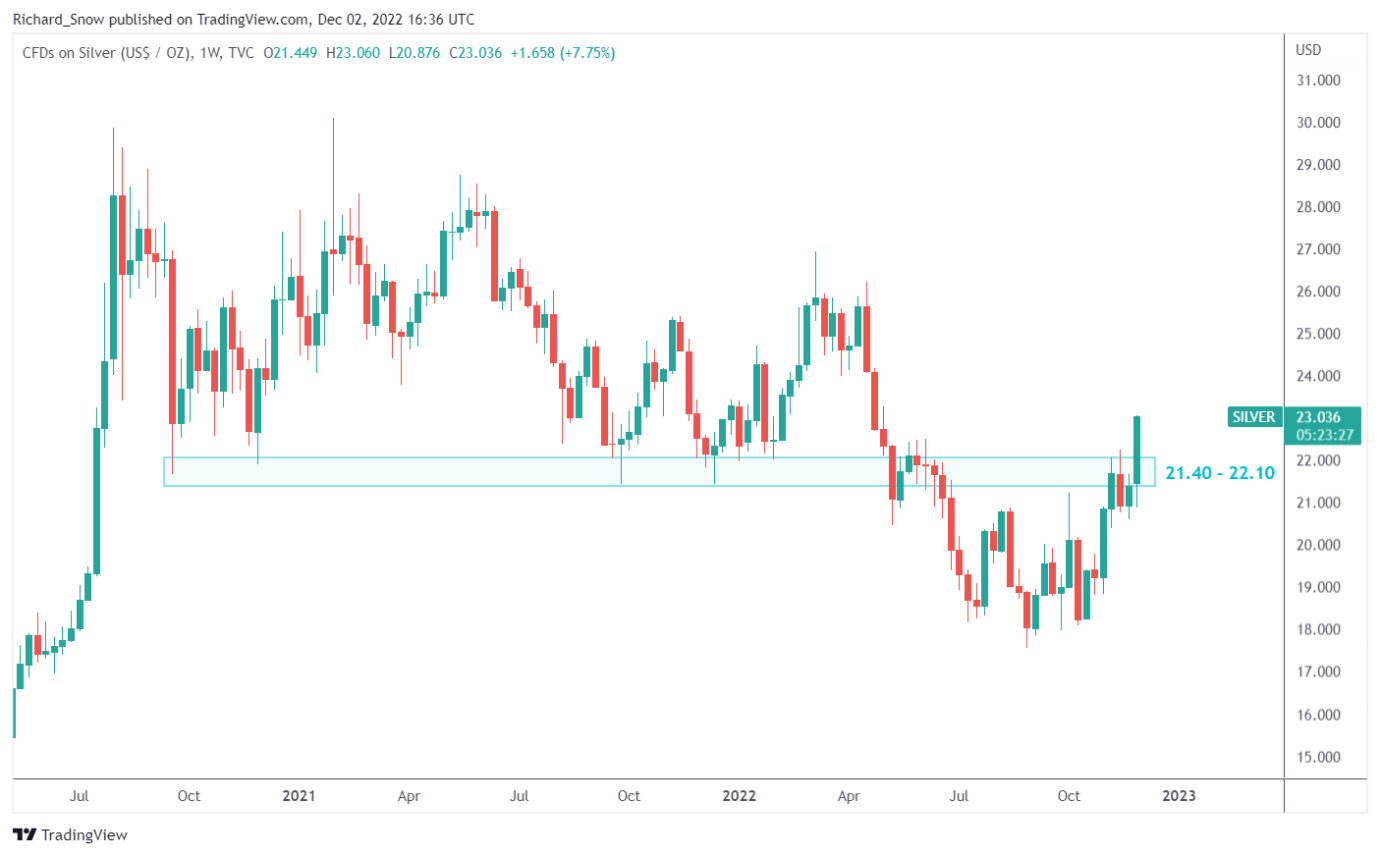
Source: TradingView, prepared by Richard Snow
The daily chart reveals the massive amount of real estate that silver could potentially trade into, after breaching all nearby resistance levels including the 200 SMA and zone of resistance previously mentioned. The next level of resistance appears at 24.90 where price action was capped in September and October 2021 as well as in early 2022.
Like gold, the RSI for silver hints that prices may soon be due for a pullback but the indicator is yet to dip back below overbought territory suggesting there may still be some room for further upside yet. Support comes in at 22.10 – the upper side of the zone of support (prior resistance).
Silver (XAG/USD) Daily Chart
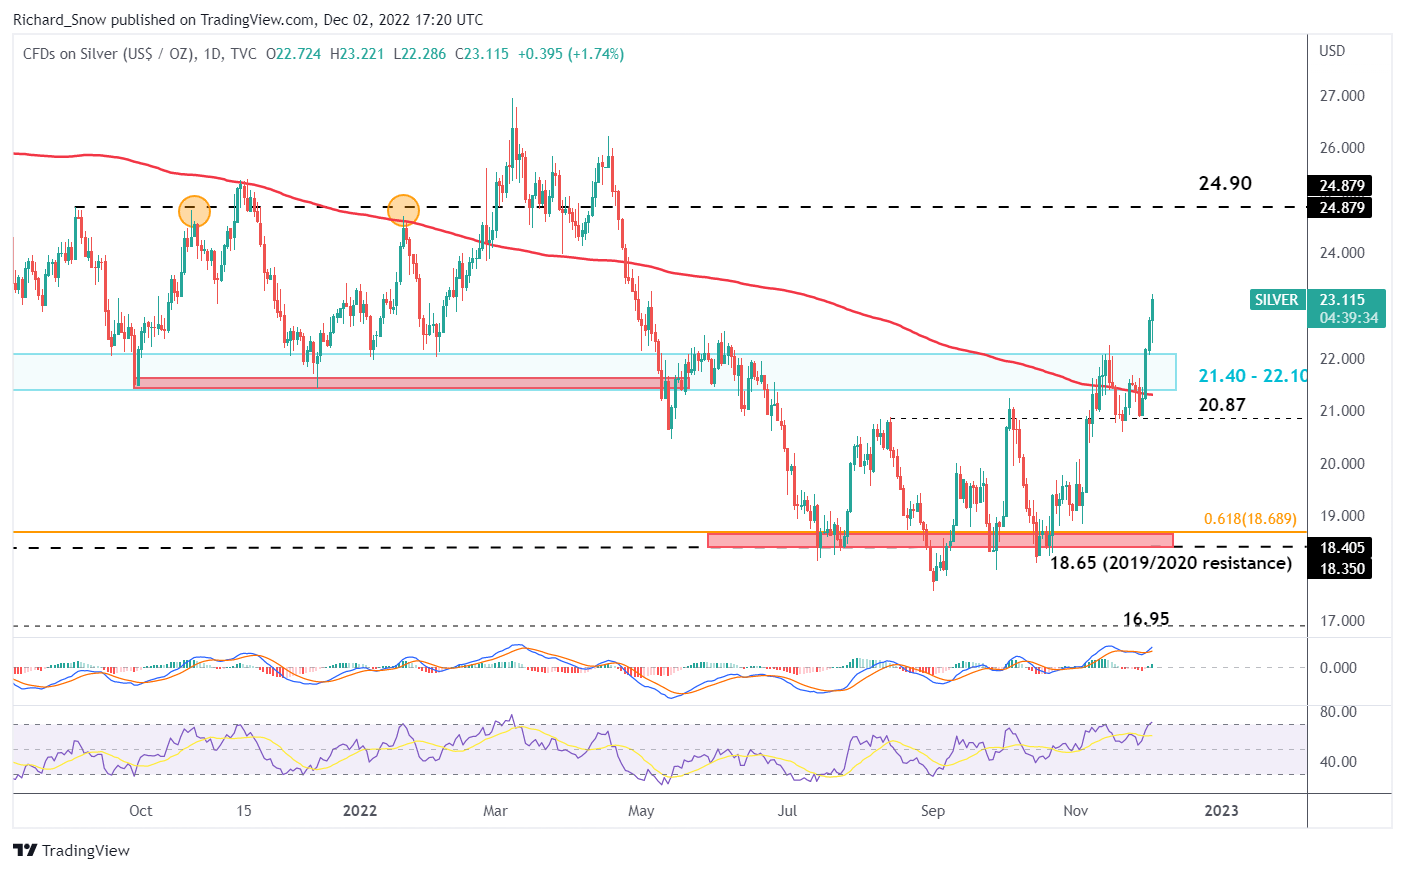
Source: TradingView, prepared by Richard Snow
--- Written by Richard Snow for DailyFX.com
Contact and follow Richard on Twitter: @RichardSnowFX


