


Gold, Silver and Oil (WTI) Weekly Forecast
- Gold weekly forecast: bearish after robust NFP figures and an anticipated hawkish hold from the Fed
- Silver weekly forecast: bearish after price action failed to make a single day of gains
- Oil (WTI) weekly forecast: bullish as a potential morning star pattern
- The analysis in this article makes use of chart patterns and key support and resistance levels. For more information visit our comprehensive education library
Weekly Gold Forecast: Bearish
Gold endured a massively volatile week, spiking well above the prior all-time-high to create a new all-time-high around $2146.79 before reversing those gains and trading comfortably down last Sunday as prices overcorrected. The rest of the week revealed price action failing to mount a sustainable recovery and ultimately prices continued to decline, particularly after NFP data provided the dollar a reason to claim back some lost ground. 30-day gold volatility has shown a tendency to spike higher and ended the week with a massive spike higher before ultimately closing towards the open, slightly in the green.
Gold Volatility Index (GVX)
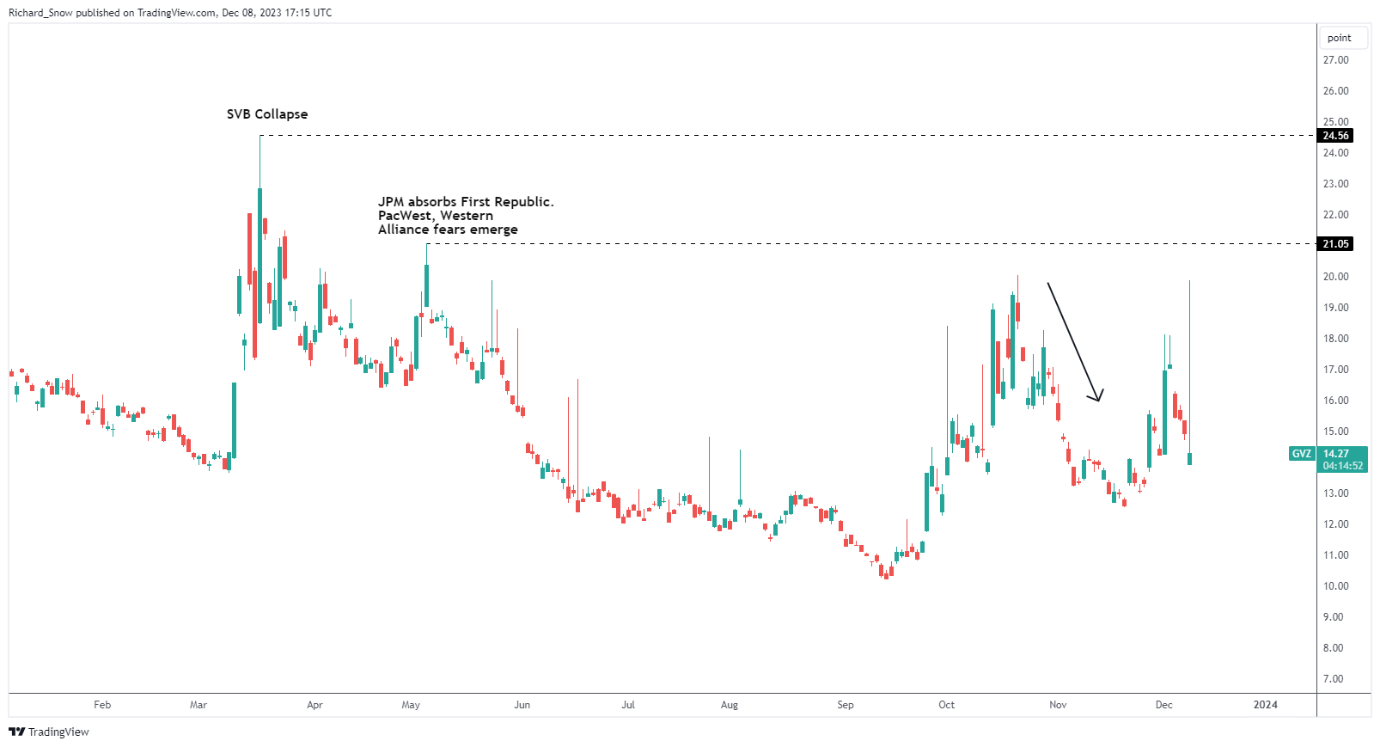
Source: TradingView, prepared by Richard Snow
Gold closed out the week trading below the $2010 mark which has been a notable level whether approached as support or resistance. A start to the week below $2010 opens up the possibility of a retest of the $1985 level and potentially even a move towards the (blue) 50 -day simple moving average (SMA) or (red) 200-day SMA around $1960 and $1951, respectively. The fourth and final support level appears at $1937.
Gold has recovered from overbought conditions much like it did at the end of October/ beginning of November when prices pulled back significantly. Incoming data like US CPI and the FOMC statement + press conference have the potential to move dollar markets in a big way and gold is not immune to that. In the event the pullback is short-lived, $2010 is the most imminent level of resistance.
The war premium for gold is up for debate with some suggesting the end of the ceasefire and greater aggression from the Israeli Defence Force contributed to the spike higher, while others point to flows via increased purchases of gold in response to institutional call option selling. Nevertheless, gold remains a safe-haven asset and may stand to benefit, however the direction of travel appears to be lower.
Gold (XAU/USD) Daily Chart
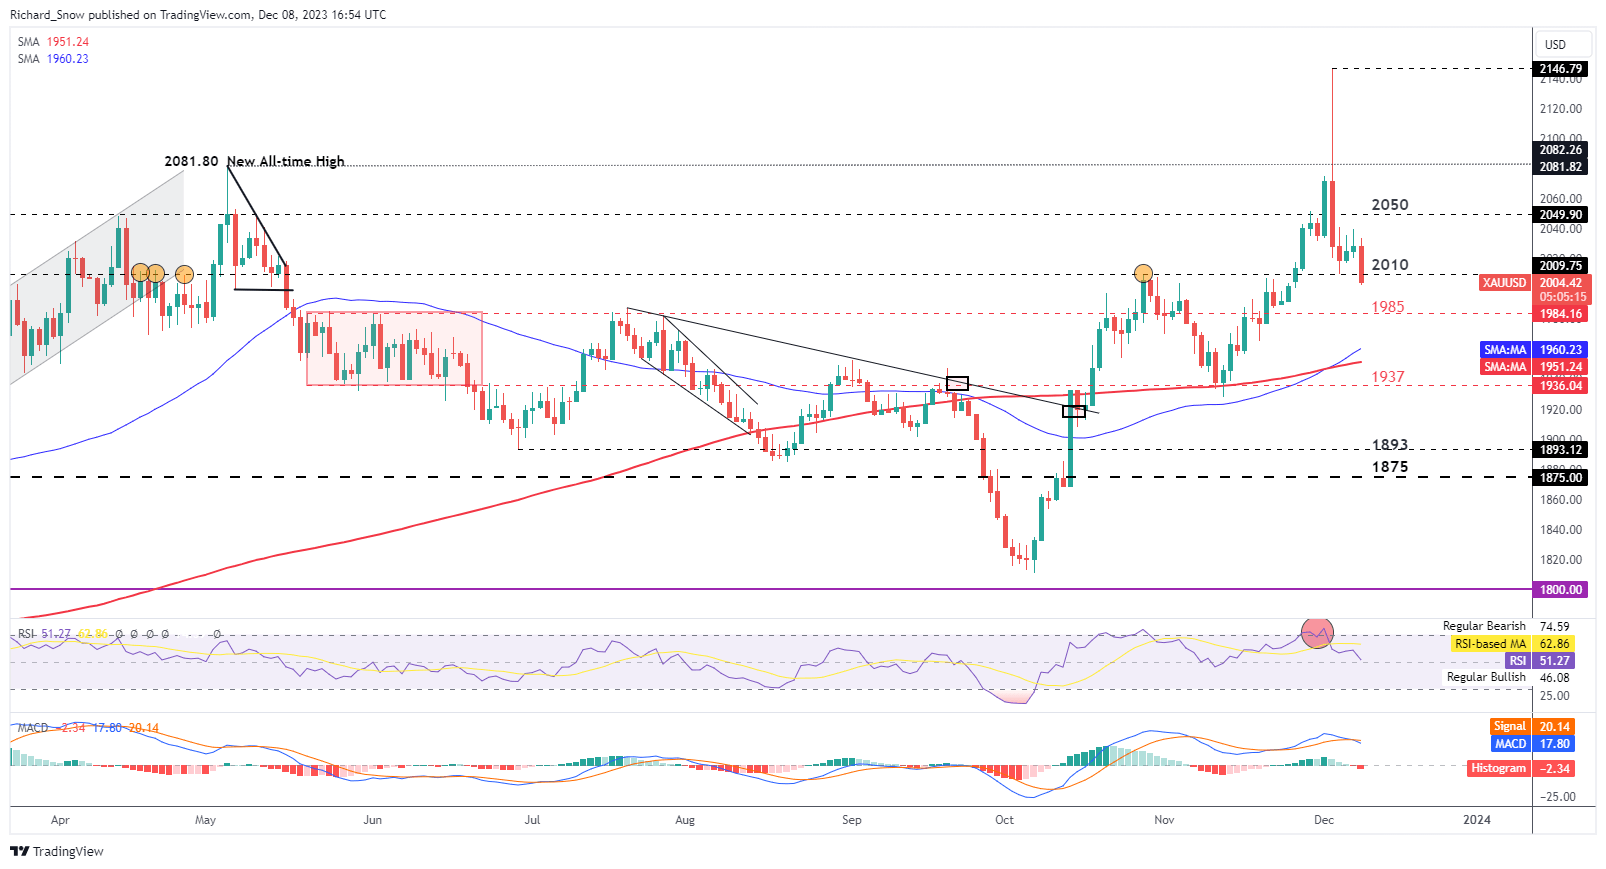
Source: TradingView, prepared by Richard Snow

Silver Weekly Forecast: Bearish
Silver’s price action reveals a less volatile descent than that of gold but also shows a more consistent move lower. In fact, this last week silver traded lower for 5 consecutive days and hurtled past the 200 SMA on Friday with ease. The next dynamic level of support appears at the 50 SMA before the 38.2% Fibonacci level of the 2021 to 2022 decline at $22.35 comes into play.
The 38.2% Fib level has provided support on numerous occasions previously (circled in red). This should provide a stern test in the week ahead and traders ought to keep a close eye on the RSI which is not yet at risk of breaching oversold territory. A failure to build upon prior losses, could see the 200 SMA providing resistance followed by the lesser observed 50% Fibonacci retracement.
Silver (XAG/USD) Daily Chart
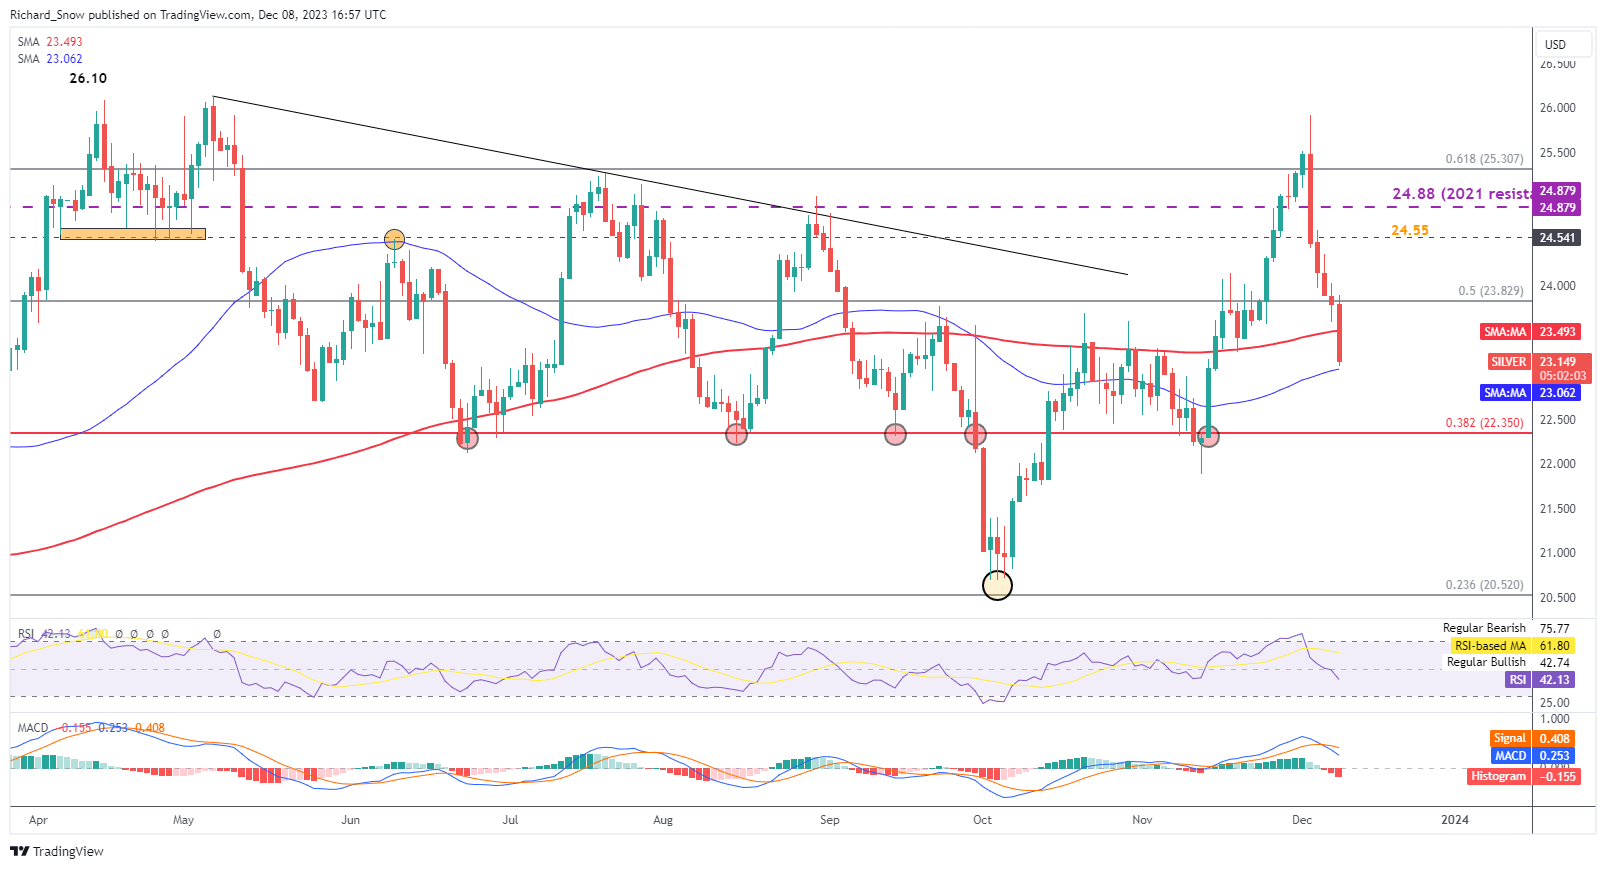
Source: TradingView, prepared by Richard Snow
The weekly chart below provides context as to just how big the silver selloff was this last week as the metal looks to start the week back within the prior descending channel.
Silver Weekly Chart
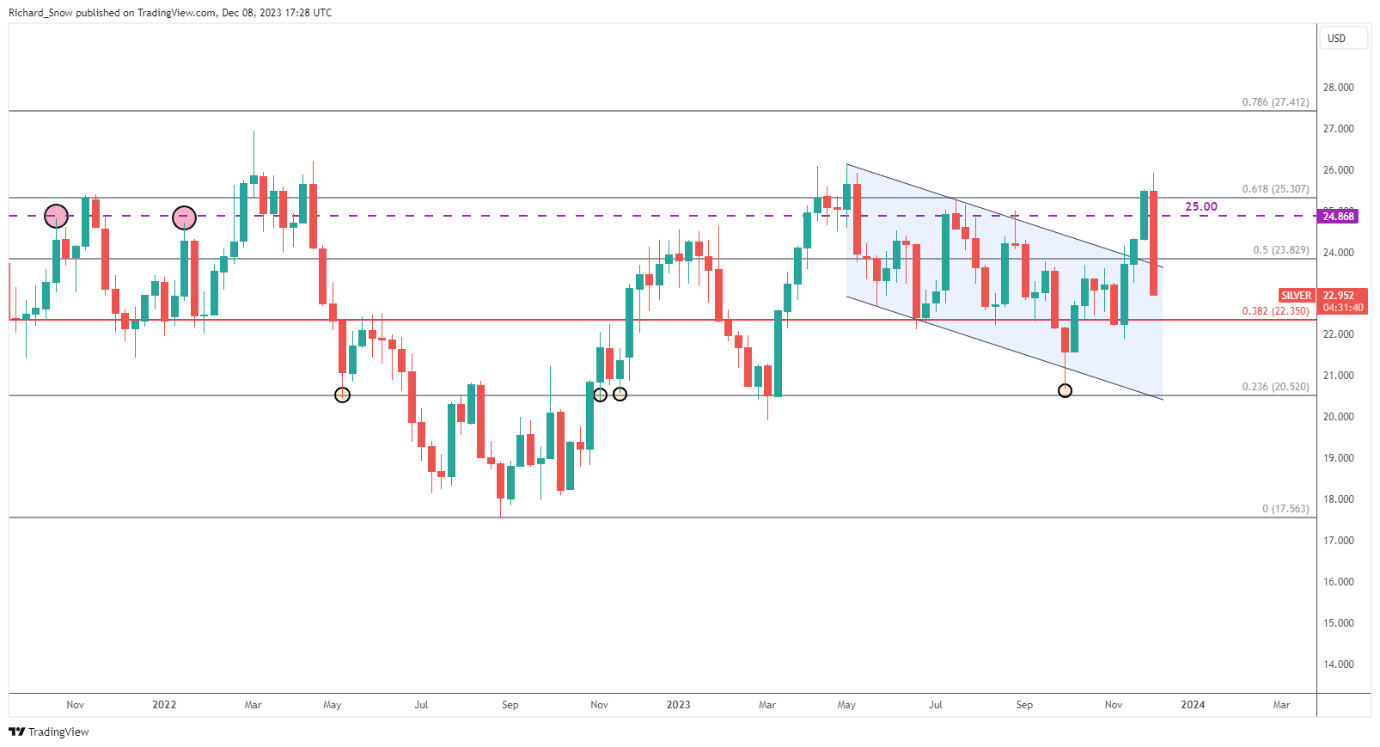
Source: TradingView, prepared by Richard Snow
Oil (WTI) Weekly Forecast: Bullish
Oil prices have declined since OPEC+ appeared a fractious group, with a number of African nation unhappy with proposed production quotas despite struggling to meet their existing output targets in previous months.
Voluntary supply cuts from Saudi Arabia and Russia were extended into Q1 of 2024 with a senior Saudi official stating that supply cuts will eventually be rolled back in a stable manner but are set to remain for some time. In addition, further cuts from other member nations have taken the voluntary cuts from around 1.3 million barrels per day (bpd) to 2.2 mbpd from January. Oil prices have been in decline as the global growth slowdown weighs on anticipated future oil demand. Adding to this, the US has ramped up its oil supply at record pace for the second straight month – adding to supply and keeping prices suppressed.

But signs of a reprieve are emerging slowly. The first comes via the US EIA weekly demand numbers for week 48 which came in at an all-time-high despite the economy heading for a more modest growth figure in Q4 opposed to Q3. Also, the daily oil chart closes out the week on what appears to be a morning start pattern – a bullish reversal pattern. While the trend remains to the downside, the more positive end to the week offers green shoots of optimism for a partial recovery into the coming week. $72.50 is the nearest level of resistance followed by the crucial, long-term level of $77.40. The last bullish factor to consider is that the US Department of Energy (DoE) is has indicated its intention to replenish its SPR levels at these low prices. Support resides at $67 if the longer-term trend remains too strong.
Oil (WTI) Daily Chart
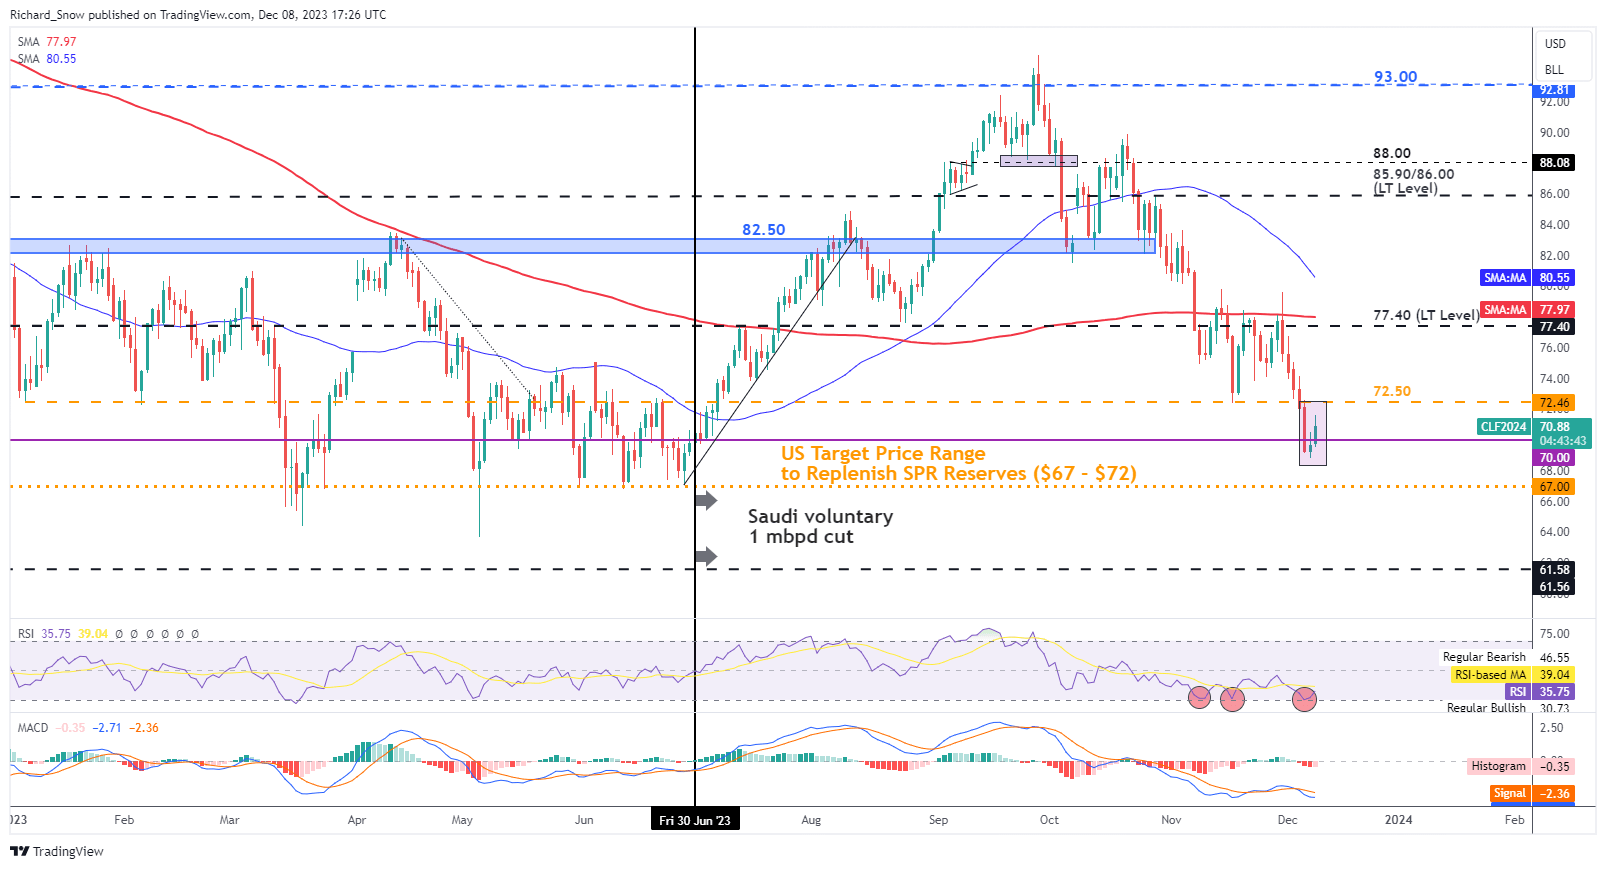
Source: TradingView, prepared by Richard Snow
If you're puzzled by trading losses, why not take a step in the right direction? Download our guide, "Traits of Successful Traders," and gain valuable insights to steer clear of common pitfalls that can lead to costly errors.

--- Written by Richard Snow for DailyFX.com
Contact and follow Richard on Twitter: @RichardSnowFX


