


Gold Price (XAU/USD), Chart, and Analysis
- Gold’s recent push higher stalls.
- Retail traders shrink their weekly short positions.

The latter half of this week is set to boost market volatility with high-importance events and data releases scheduled over the next three days. Later today, Fed chair Jerome Powell will give a speech to the Brookings Institute on The Economy, Inflation, and the Labor Market, which will be closely parsed by market participants for any clues to Fed policy going forward. On Thursday, the latest look at the Fed’s preferred inflation measure, core PCE, while on Friday the monthly US Jobs Report (NFPs) hits the screens at 13:30 GMT. A busy, and potentially volatile time ahead for the rest of the week.
For all market-moving data releases and events, see the DailyFX Economic Calendar.

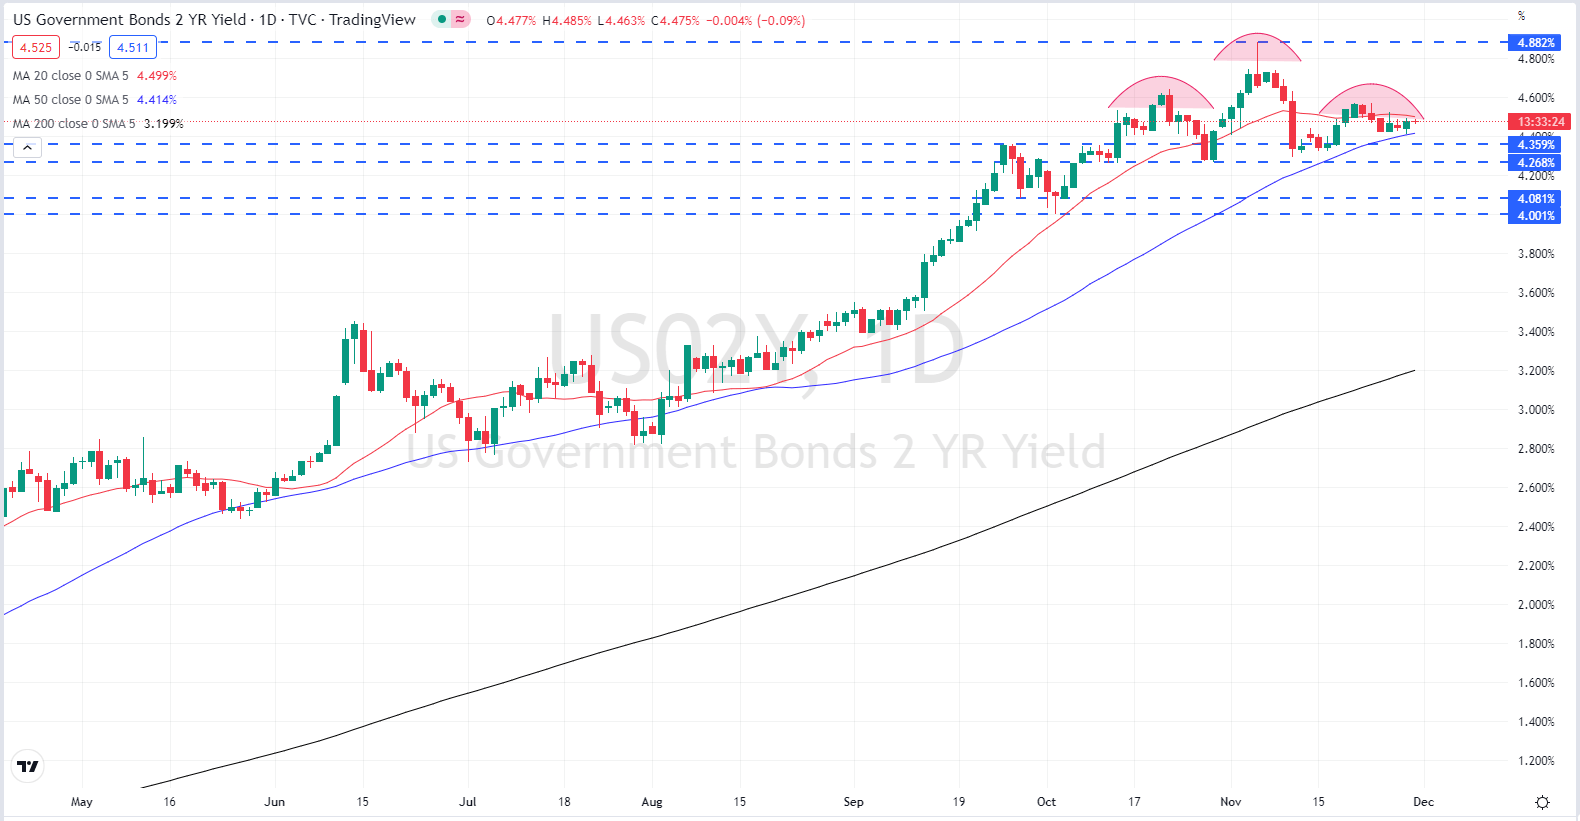
Ahead of Jerome Powell’s speech, short-dated US Treasury yields have picked up after drifting lower recently. The yield on the 1-year UST is 4 basis points higher at 4.82%, while the 2-year UST is 2 basis points higher at 4.48%. The technical outlook for the 2-year UST is starting to turn negative though with a head and shoulders pattern being formed on the daily yield chart. While a breakdown to the neckline at 4.27% may happen, yields should remain stable around here.
US Treasury 2-Year Yield Chart
Gold continues to take its cue from US bond yields and moves in the US dollar and precious metal traders will need to listen to chair Powell at 18:30 GMT. From a technical perspective, we noted recently that a bullish flag was being formed but this did not play out in full.
Gold Price Consolidates, Is a Bullish Flag Being Formed?
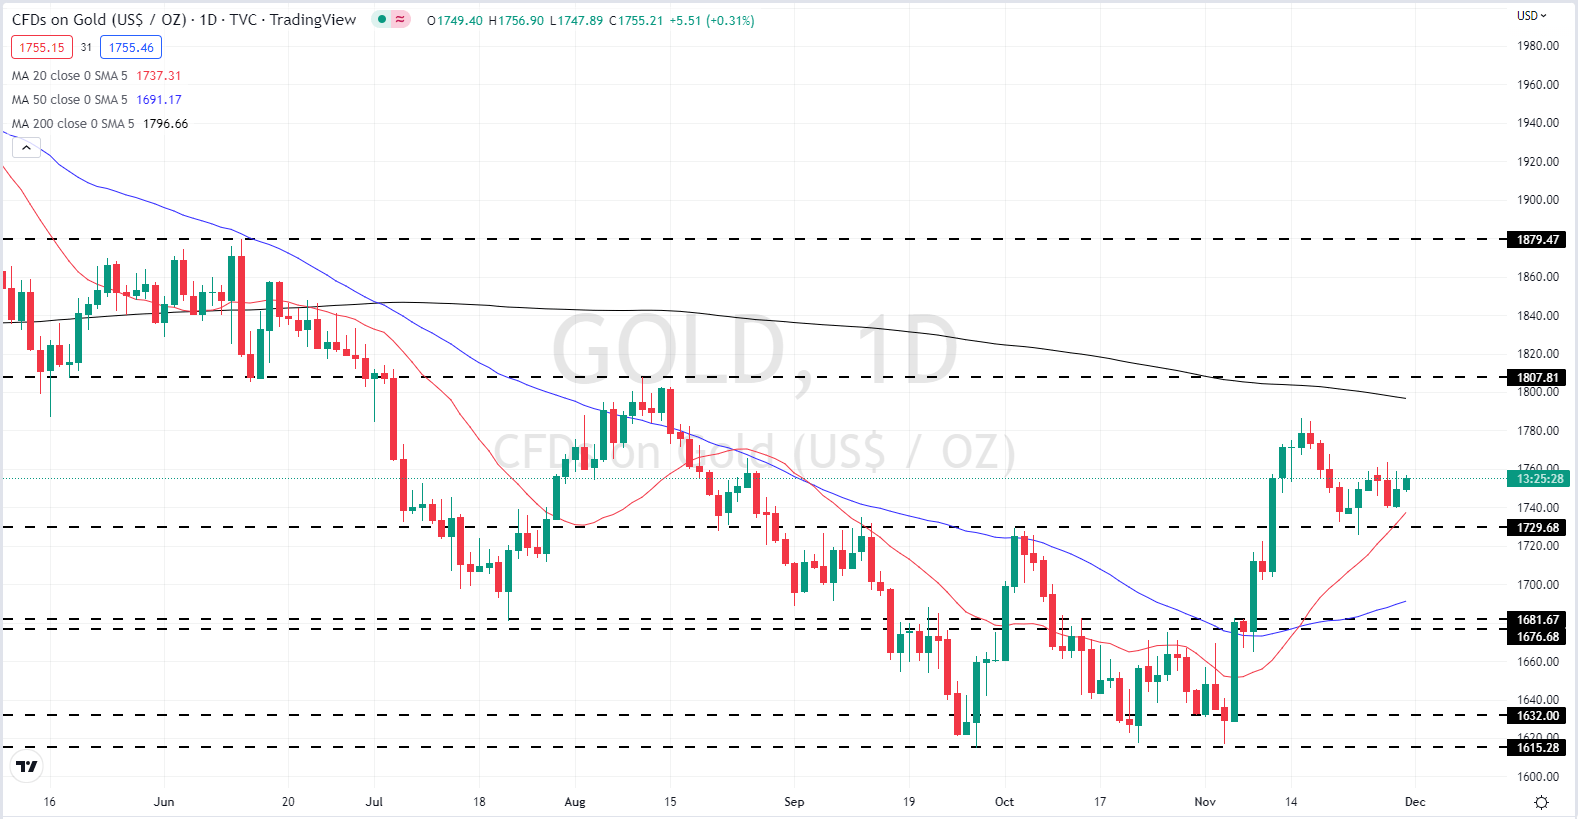
Initial support on the daily gold chart starts at $1,740/oz. before $1,726/oz. comes into play, while Monday’s $1,763.8/oz. high should cap any pre-Powell move.
Gold Daily Price Chart – November 30, 2022
All Charts via TradingView
| Change in | Longs | Shorts | OI |
| Daily | 1% | -3% | -1% |
| Weekly | 2% | -8% | -2% |
Retail Traders Slash Their Weekly Net-Short Positions
Retail trader data show 75.81% of traders are net-long with the ratio of traders long to short at 3.13 to 1.The number of traders net-long is 2.60% lower than yesterday and 3.88% higher from last week, while the number of traders net-short is 4.69% higher than yesterday and 33.62% lower from last week.
We typically take a contrarian view to crowd sentiment, and the fact traders are net-long suggests Gold prices may continue to fall. Positioning is less net-long than yesterday but more net-long from last week. The combination of current sentiment and recent changes gives us a further mixed Gold trading bias.
What is your view on Gold – bullish or bearish?? You can let us know via the form at the end of this piece or you can contact the author via Twitter @nickcawley1.


