


Gold, XAU/USD, US Dollar, ISM Services, Evening Star, Technical Analysis - Briefing:
- Gold prices sink as US Dollar climbs and Wall Street drops
- US ISM Services data offered hawkish Fed policy estimates
- XAU/USD Bearish Evening Star candlestick pattern in focus

Gold prices sank over 1.6% on Monday, offering a pessimistic start to the new trading week. The anti-fiat yellow metal was pressured by a combination of a surging US Dollar and Treasury yields, likely reflecting more hawkish Federal Reserve monetary policy expectations. Unsurprisingly, Wall Street broadly underperformed.
A key culprit was strong ISM services data, which crossed the wires at 56.5 for November against the 53.3 estimate. ISM jumping to 56.5 from 54.4 in October was also the most aggressive since March 2021. The data underscored the health and vigor of the services industry, which also likely speaks to solid consumer expenditures. The latter is the largest segment of GDP.
With the Fed in a blackout period until next week’s interest rate decision, markets will likely remain very sensitive to incoming economic data as the key driver for momentum. Last week, a solid US non-farm payrolls report crossed the wires as the country unexpectedly added 263k positions for November against the 200k estimate.
Looking ahead to the remaining 24 hours, the economic docket is light. That places the focus for XAU/USD on general risk appetite. This could leave gold vulnerable if markets continue to marinate on the implications of both NFPs and the ISM Services report.
Gold Technical Analysis
Looking at the daily chart, gold prices have left behind a bearish Evening Star candlestick pattern. Downside follow-through could open the door to reversing gains achieved since early November. Keep a close eye on the 20-day Simple Moving Average, which is immediate support. Clearing lower exposes the November 23rd low at 1725. Otherwise, a daily close above 1810 opens the door to uptrend resumption, exposing the 61.8% Fibonacci extension at 1830.65.
Trade Smarter - Sign up for the DailyFX Newsletter
Receive timely and compelling market commentary from the DailyFX team
XAU/USD Daily Chart
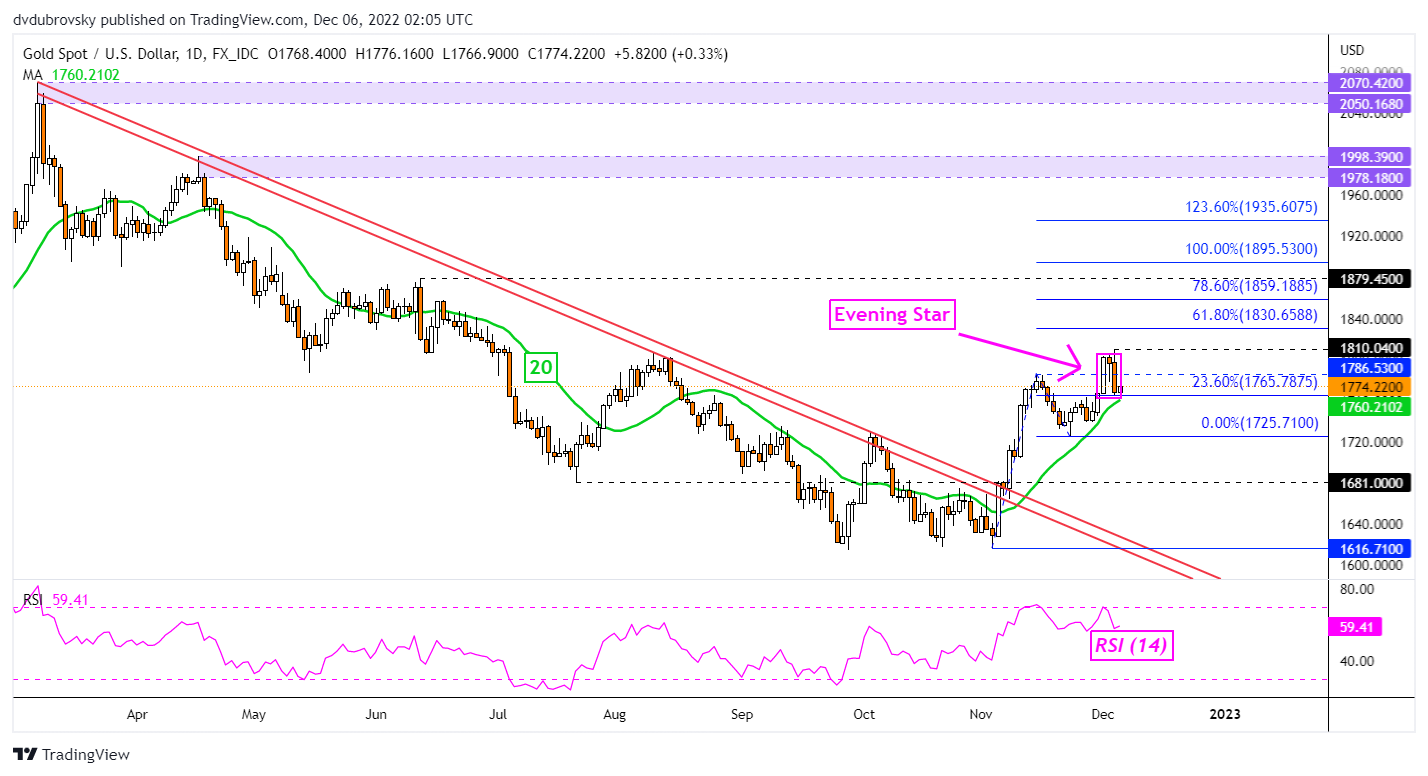
Chart Created Using TradingView
--- Written by Daniel Dubrovsky, Senior Strategist for DailyFX.com
To contact Daniel, follow him on Twitter:@ddubrovskyFX


