


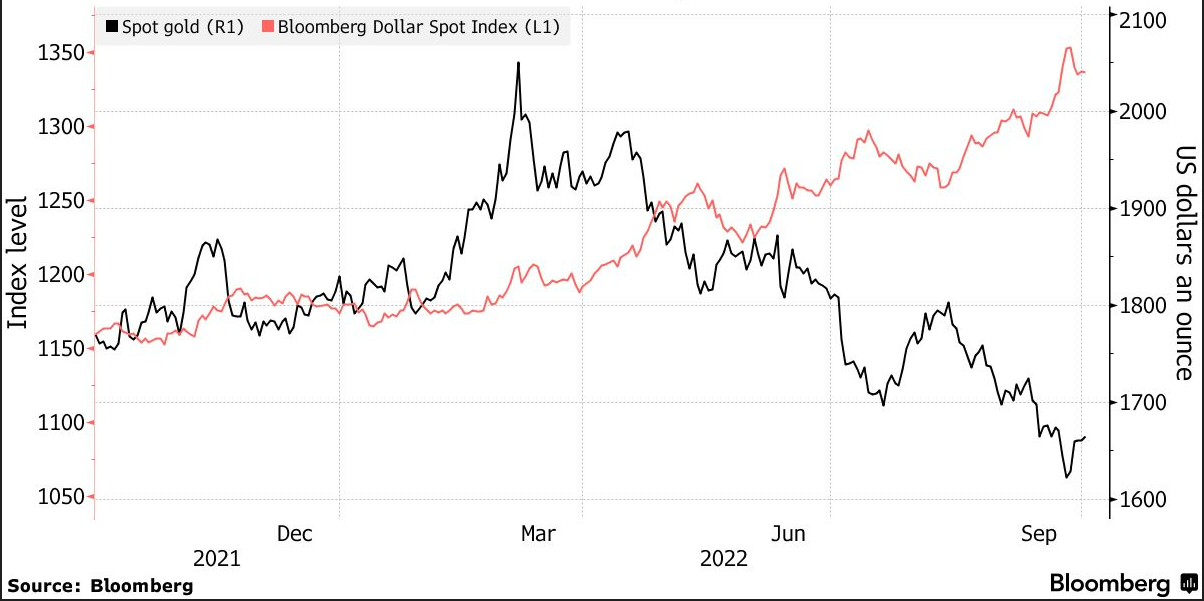
- Dollar Index Down Around 3% from September 28 High.
- XAU/USD Recorded its Best Day in Almost Six Months.
- External Factors Still Key to Bullions Next Move.

XAU/USD Fundamental Backdrop
Gold extended its upside rally from fresh two-year lows, a move which has largely been driven by dollar weakness and retreating treasury yields. In a further boost for market sentiment, yesterday’s ISM Manufacturing PMI data from the US came in softer than expected. The ISM print came in at 50.9 in September, down from 52.8 prior while new orders and employment have firmly entered contractionary territory. Markets interpreted this as a sign of potential softening by the US Federal Reserve on its rate hike plans.
Dollar Index vs Spot Gold Correlation (Inverse)
Central Banks and their Rate Hike Cycles
The improving sentiment in markets to start the week has resulted in the Fed’s tightening prospects being questioned. This may be a bit premature given the US domestic economy remains in good shape, with Friday’s NFP (non-farm payrolls) data holding the key for further hawkish pricing. The Reserve Bank of Australia (RBA) meanwhile surprised markets today with a rather dovish 25bp hike, which quite possibly added to the hopes of a more cautious approach from Central Banks including the FED. Looking at the updated projections for the Fed funds target rate we can see an 8% increase in the last week that the target rate will be in the 350-375bp range come November 2nd.
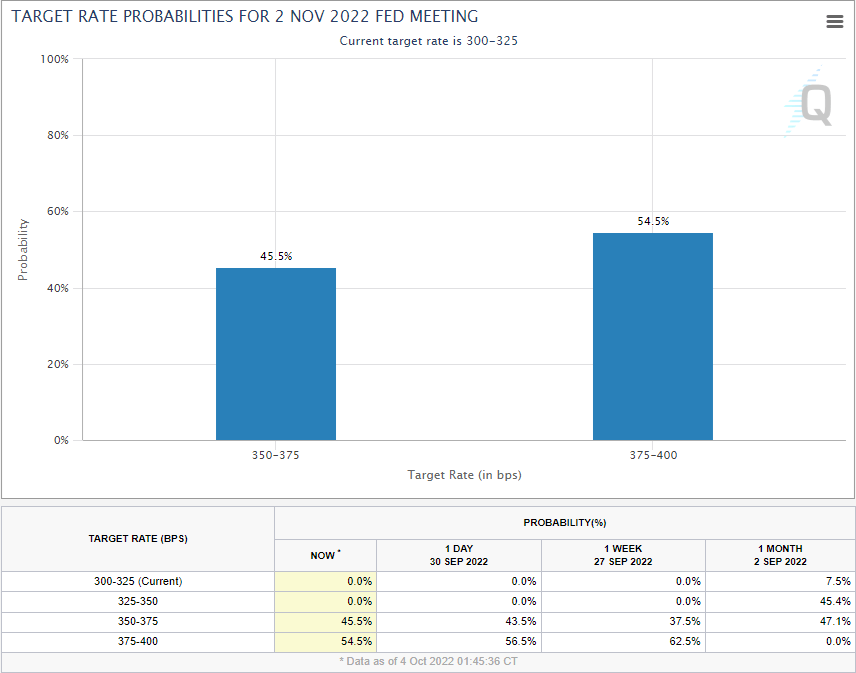
Source: CME FedWatch Tool
External Factors Driving Bullion
The year has proved interesting for the precious metal as the US Dollar has been preferred as a safe haven while unprecedented treasury yield rates have played a massive part. Any future moves from the metal will largely rest on US data moving forward with this week’s jobs numbers holding the potential to send the bullion back toward its recent lows. As markets digest each piece of data and Fed funds target rates continue to shift expect an increase in volatility and abrupt changes in direction for the metal. Later today could provide some of this as we have a host of Federal Reserve policymakers speaking, whose rhetoric will no doubt be closely observed by market participants.
For all market-moving economic releases and events, see the DailyFX Calendar
XAU/USD Daily Chart – October 4, 2022
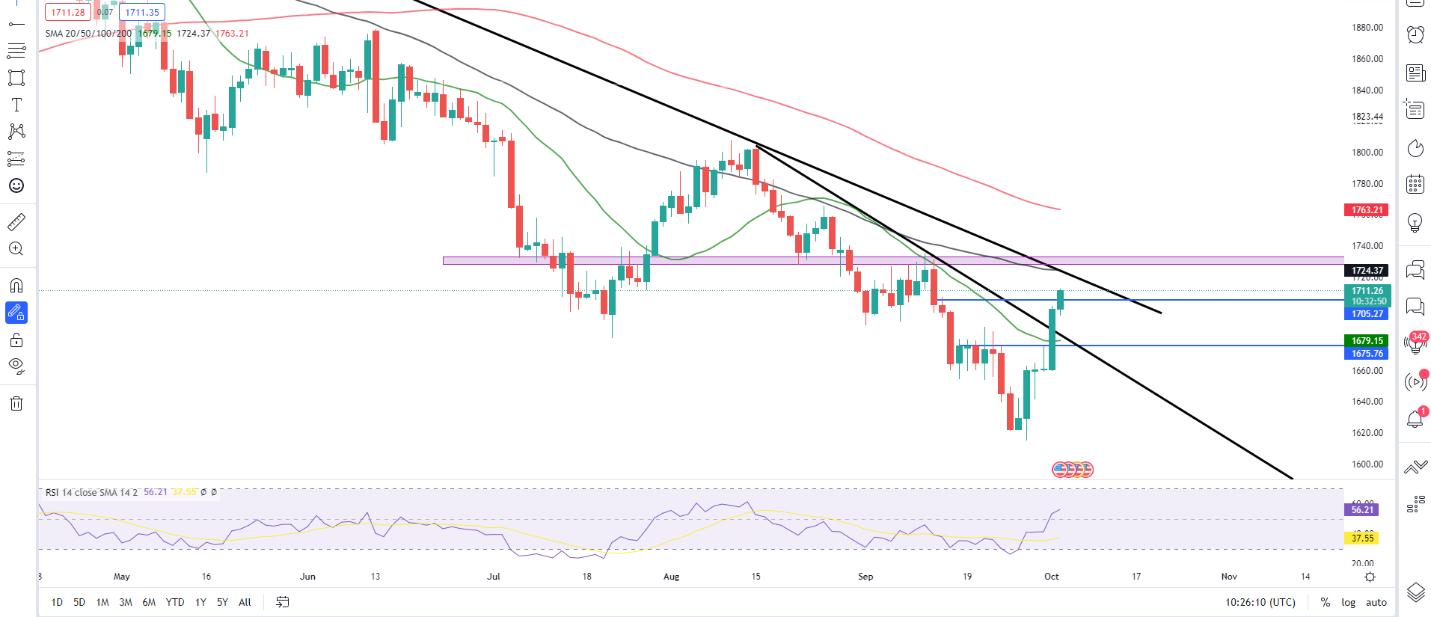
Source: TradingView
From a technical perspective, we have rallied some 400 odd pips now without any significant pullback. We trade above the 20-SMA with the 50-SMA and trendline just above current price providing a significant resistance area. Long-term outlook remains bearish with the burning question being, at what price levels could the bears return?
Short-term the 1700 key psychological level is key while a deeper pullback could see a retest of the 20-SMA which could provide support for a further upside move. Should the metal rally higher from current price or 1700 support, we could test significant resistance which lies in wait around the 1724-1730 area.
Introduction to Technical Analysis
Moving Averages
Recommended by Zain Vawda
Key intraday levels that are worth watching:
Support Areas
•1700
•1680
•1650
Resistance Areas
•1724
•1750
•1775
| Change in | Longs | Shorts | OI |
| Daily | 1% | -3% | -1% |
| Weekly | 2% | -8% | -2% |
Resources For Traders
Whether you are a new or experienced trader, we have several resources available to help you; indicators for tracking trader sentiment, quarterly trading forecasts, analytical and educational webinars held daily, trading guides to help you improve trading performance, and one specifically for those who are new to forex.
Written by: Zain Vawda, Markets Writer for DailyFX.com
Contact and follow Zain on Twitter: @zvawda


