


Gold and Silver Technical Forecast:
- Gold prices are eyeing a breakout from a Double Bottom pattern as RSI flashes bullish signal
- Silver prices fell after resistance from the 100-day SMA capped gains, while RSI fell below 50
Gold Technical Outlook: Bullish
Gold prices were on track to record modest gains on the week until prices fell around 1.2% on Friday. That move retraced the prior week’s 0.78% advance, with prices trading just below last week’s open of 1,694.69. That would mark the lowest weekly close since April 2020, putting prices down over 20% from the March swing high at 2,070.42.
A Double Bottom pattern offers the chance for a reversal of the preceding downtrend that started in March. The lows from September and last Friday set the troughs, and the early October swing high put in the peak. However, a resistance break is required to confirm the pattern. An advance over the coming week may encourage bulls to attempt a break above resistance, but a descending trendline could spoil the narrative.
Should prices pierce above resistance, however, a breakout would likely occur. The breakout target—measured by the distance between the trough lows and resistance—sits at the 1,844 level. A bullish divergence in the Relative Strength Index (RSI) suggests that bullish momentum is increasing, which bodes well for the Double Bottom breakout chances. While traders should wait for confirmation, the technical outlook is skewed upward.
Gold Daily Chart
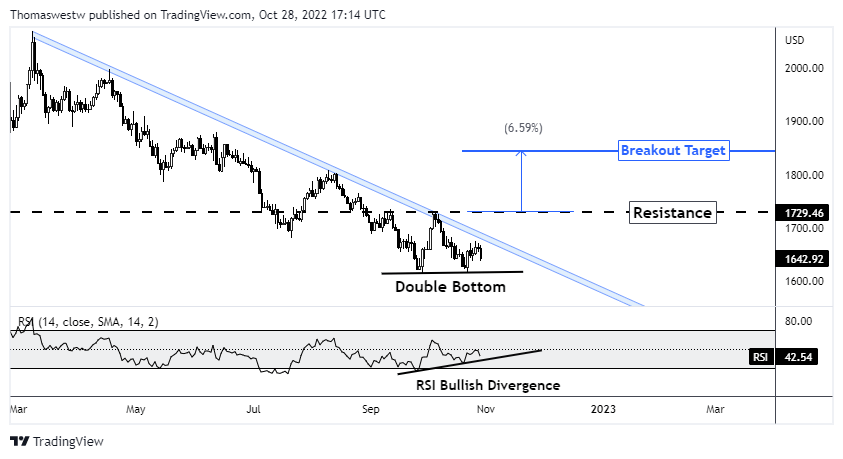
Chart created with TradingView

Silver Technical Outlook: Neutral
Silver prices traded down by more than 2% on Friday, which turned prices negative for the week. Still, more than half of last week’s 6.38% gain remains intact, and the monthly performance remains in positive territory. Silver has carved out a Falling Wedge pattern over the past year, but a short-term breakout is unlikely as wedge resistance remains around 6% above current prices.
The 100-day Simple Moving Average and 23.6% Fibonacci retracement capped prices from Wednesday to Friday. A pullback to around the 18 level, where prices found support last week, is on the cards. The RSI crossed below its midpoint on the daily timeframe indicating a lull in upward momentum. A surprise to the upside would put wedge resistance in focus.
Silver Daily Chart
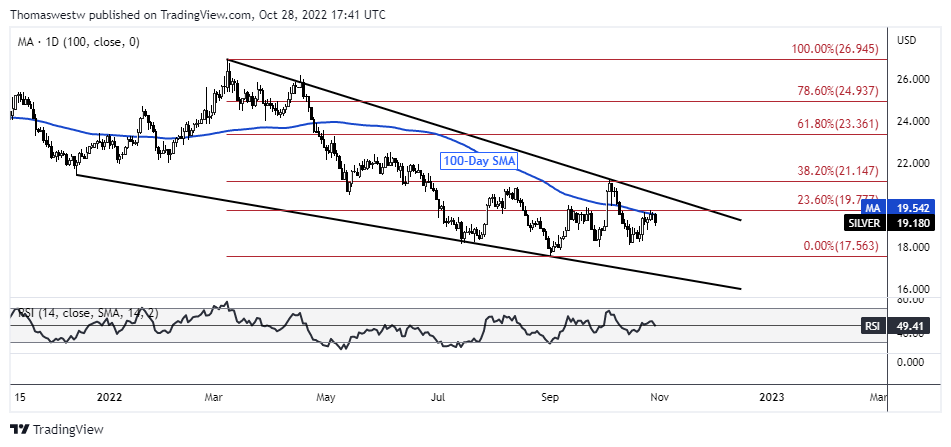
Chart created with TradingView

--- Written by Thomas Westwater, Analyst for DailyFX.com
To contact Thomas, use the comments section below or @FxWestwater on Twitter


