


British Pound Talking Points:
- GBP/USD sold off last week after a failed test at the 1.2000 psychological level. That led to a move down to support at 1.1760, but bulls have since came in to push a higher low as price sets up for another test at the big figure.
- GBP/JPY strength has continued after last week’s breakout from the falling wedge formation and price is now nearing a re-test of resistance at 169.08. Support lines up around the 168.06 Fibonacci level.
- The analysis contained in article relies on price action and chart formations. To learn more about price action or chart patterns, check out our DailyFX Education section.

The British pound is running-higher this morning and GBP/USD looks like it is setting up for another test at the 1.2000 psychological level. This is a major price level in Cable as this was the same level that came into play a few months after the Brexit referendum to help set the lows, which held as support all the way into Covid in 2020. At that point, a quick breach developed but prices soon pushed back-above the big figure, and it didn’t come back into the equation until earlier this summer.
Sellers posed a breakdown in August which led to the September collapse-like move; but now that same price is back in the picture but showing as resistance. This held the highs last week and it appears as though another re-test may soon be on the cards.
GBP/USD Monthly Chart
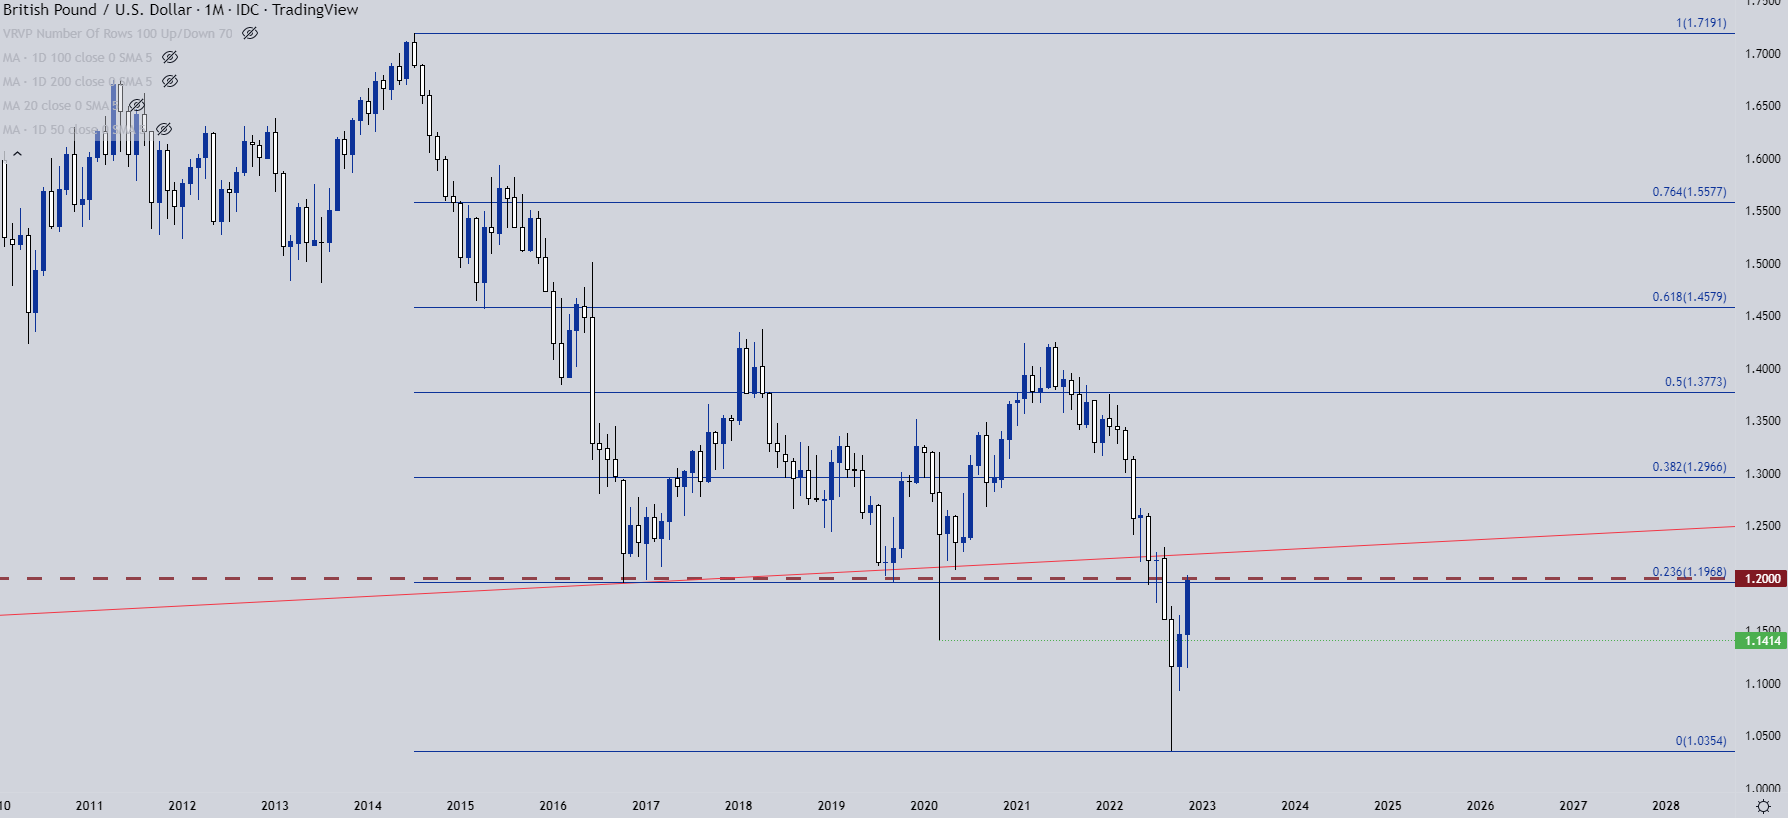
Chart prepared by James Stanley; GBPUSD on Tradingview
GBP/USD Daily
Last week produced a resistance inflection at the psychological level and prices pulled all the way back to a familiar spot of support, plotted at around 1.1760 which was the July swing low. That price helped to set the low last week and buyers have been pushing ever since.

GBP/USD Daily Price Chart
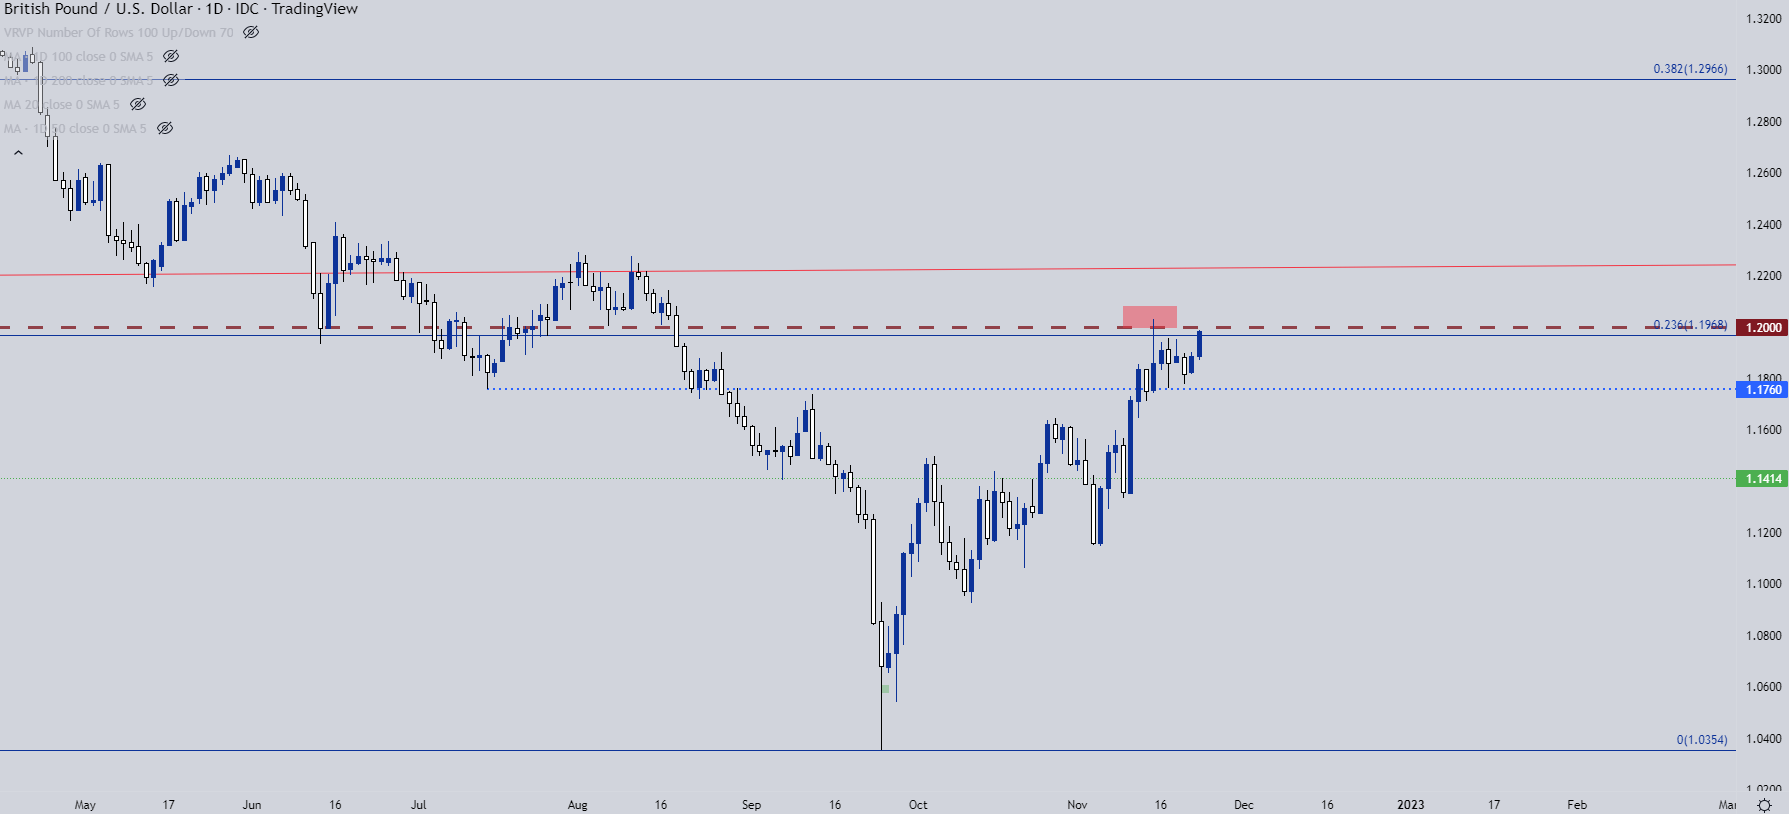
Chart prepared by James Stanley; GBPUSD on Tradingview
GBP/USD Shorter-Term
At this point, there’s support as taken from a bullish trendline and that’s helped to guide the move-higher. But, there’s been uneven distribution in the trend, leading to the build of a rising wedge formation. These are often approached with the aim of bearish reversals but the first step is the support trendline being broken, which is not showing after the bounce.
This raises the possibility of a false breakout for shorter-term themes. This would need to see a push up to a fresh high with buying demand drying up at some point after; after which reversal themes can become more attractive.
But, at this point, it seems as though bulls are going to make a move on a higher-high which would mean price action is showing both a higher-high and a higher-low, pointing to a bullish trend.

GBP/USD Four-Hour Chart
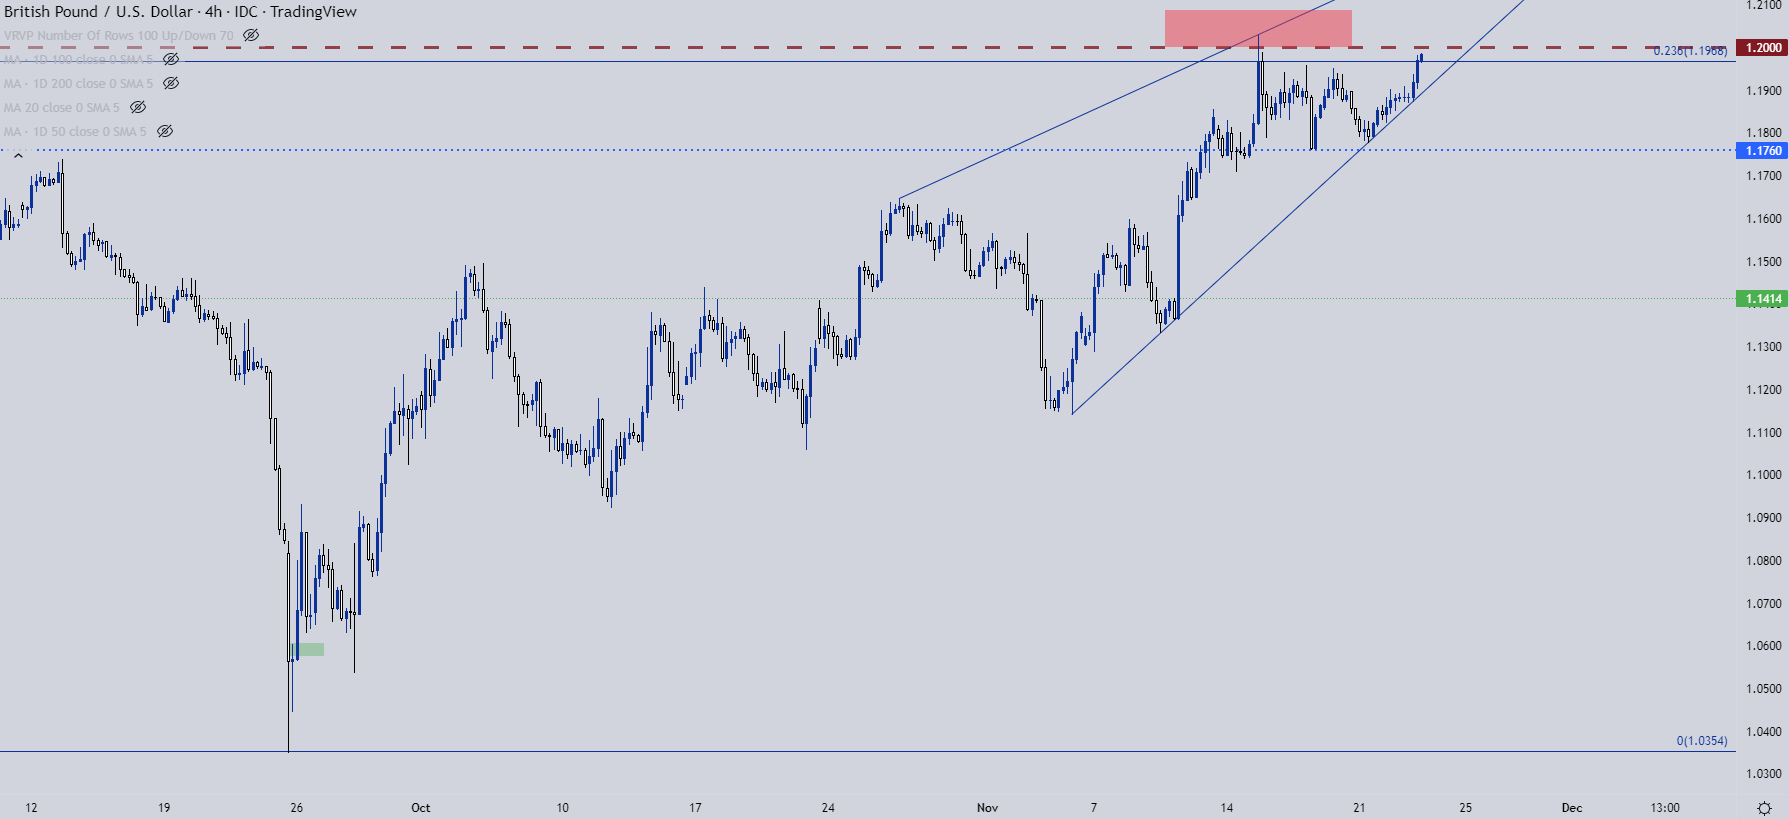
Chart prepared by James Stanley; GBPUSD on Tradingview
GBP/JPY
GBP/JPY is similarly angling up for a resistance test. The swing-high from Nov. 7th is at 169.08 and that inflection led to the build of a falling wedge formation. This is the mirror image of the rising wedge above and the falling wedge is often tracked with the aim of bullish reversals which is what’s shown here over the past couple of weeks.
I had looked into GBP/JPY earlier in the week, highlighting a return of Yen-weakness in the pair as the bullish move continued to develop. Price was testing a spot of resistance-turned-support at 167.20 and that helped to mark the low before buyers extended the move into current resistance.
At this stage, there’s support potential around the 168.06 Fibonacci level and there’s a possibility of breakout at the 169.08 price. Above current resistance is the 170.00 psychological level, which becomes the next logical resistance area to look to on a topside break. Bulls weren’t able to hold the move above 170.00 for very long during the prior test so there’s very little reference above that price until the 172.13 level comes into play.
GBP/JPY Four-Hour Price Chart
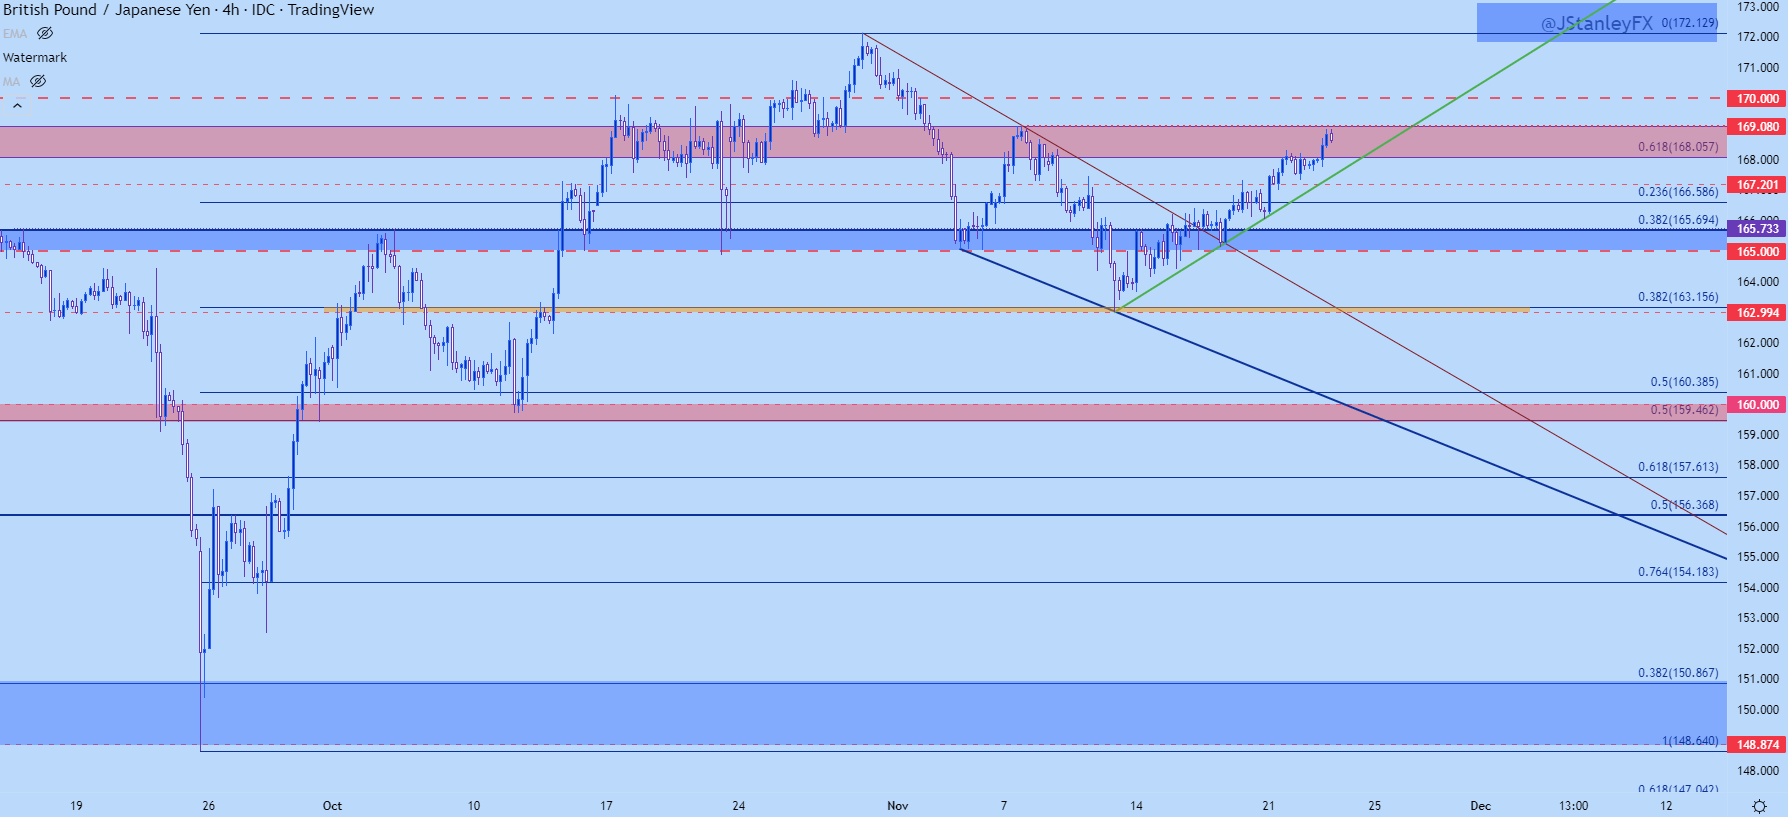
Chart prepared by James Stanley; GBPJPY on Tradingview
--- Written by James Stanley, Senior Strategist, DailyFX.com & Head of DailyFX Education
Contact and follow James on Twitter: @JStanleyFX


