


FTSE News and Analysis
- Shocking PMI data overshadows PM vote despite a weaker pound
- FTSE 100 technical considerations – significant levels to watch for bearish continuation
- Markets look ahead to the October 31st UK fiscal plan to be delivered by the new PM

Shocking PMI Data Overshadows PM vote despite a Weaker Pound
This morning’s UK PMI data confirmed that the services sector has joined manufacturing in a contraction (trading below the 50 mark). The initial price action appeared rather calm but the pound has dropped a fair amount as markets digested the specifics of the report. Manufacturing new orders fell to 38.6 vs 44.8 in September underlining the effects of higher prices and lower demand.
At 14:00 (UK time) the race for the new prime minister is due to be announced and it remains to be seen whether Rishi Sunak’s main rival, Penny Mordaunt, can secure the backing of 100 MPs. If not, Mr Sunak will be announced as the UK’s third prime minister this year. The market response to Sunak as PM should be overall positive but the job ahead is extremely difficult – reflected in the FTSE 100 indecisive price action.
The pound certainly has not shown any obvious signs of strength even as the Bank of England continues to hike rates and cable took a turn for the worse in the aftermath of the PMI data. The BoE is anticipated to hike by 75 next week according to market implied probabilities, but there is a chance of a slower 50 bps hike instead after the Deputy Governor of the Bank of England, expressed concern that market expectations of rate hikes may be too aggressive.
FTSE 100 Technical Considerations
The FTSE 100 continues to search for direction amid political, fiscal and economic uncertainty. However, worsening fundamentals coupled with persistently high inflation means that riskier assets like equities are facing a bearish outlook into year end.
The daily chart thus far resembles a long-legged doji candle, symptomatic of a volatile but ultimately indecisive day of trading. The FTSE is yet to recover to levels witnessed before the mini-budget shock toward the end of September but global equities are trending lower as a whole, meaning a move higher remains a great challenge. Price action has provided lower highs and lower lows as the index oscillates with an overall bearish lean. The recent high of 7103 is the nearest level of resistance followed by 7264 – a well-observed level of support throughout most of this year that coincides roughly with the 50 SMA.
The zone of support (6940-6980) provides the nearest major test for a bearish continuation. A break and hold below the zone opens up the long-term level of support at 6750.
FTSE 100 Daily Chart
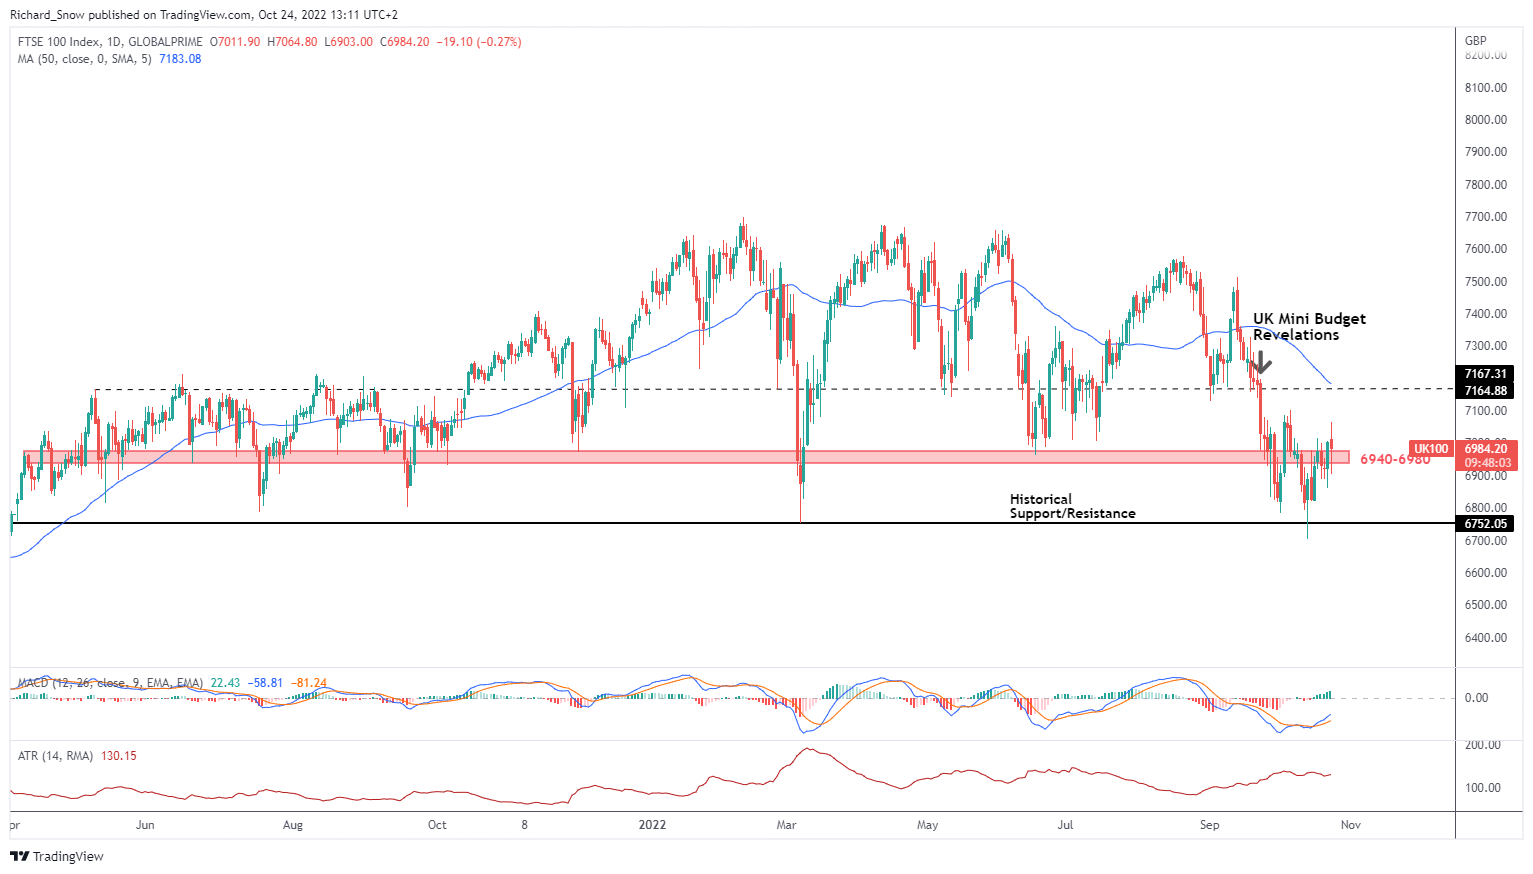
Source: TradingView, prepared by Richard Snow
| Change in | Longs | Shorts | OI |
| Daily | -28% | 15% | 6% |
| Weekly | -51% | 63% | 22% |
The monthly chart below helps to view the longer-term major level of support at 6750 – a level that acted as both support and resistance for a long period of time. With the BoE anticipating the UK to enter into a recession in Q4, the 6750 level remains crucial if we are to see lower equity valuations into next year.
FTSE 100 Monthly Chart Depicting the LT level of Support
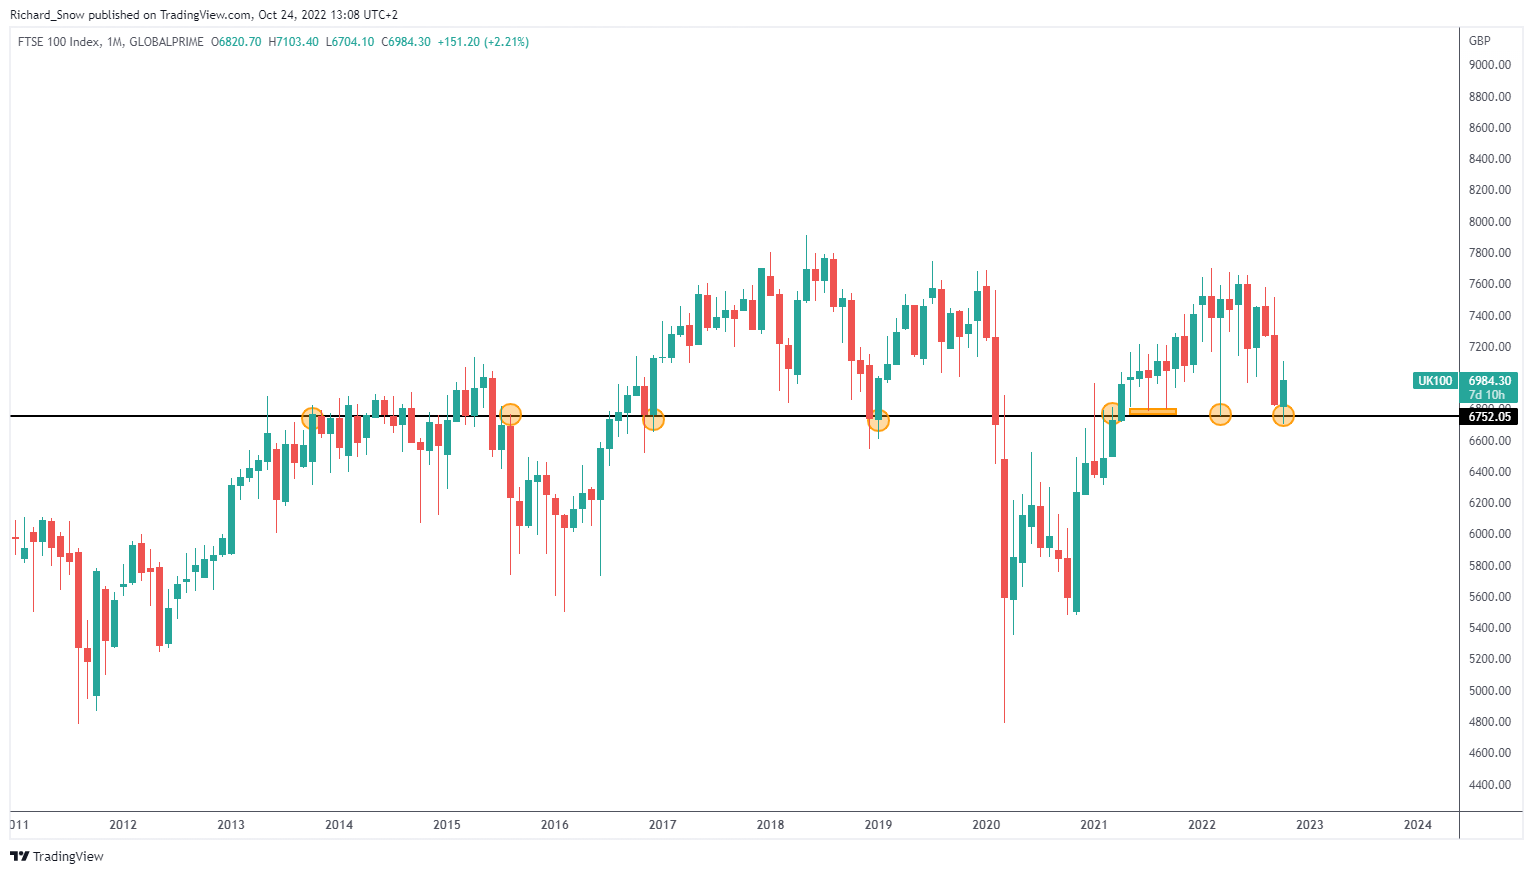
Source: TradingView, prepared by Richard Snow
Trade Smarter - Sign up for the DailyFX Newsletter
Receive timely and compelling market commentary from the DailyFX team
--- Written by Richard Snow for DailyFX.com
Contact and follow Richard on Twitter: @RichardSnowFX


