Article by IG Senior Market Analyst Axel Rudolph
FTSE 100, DAX 40, S&P 500 - Analysis and Charts
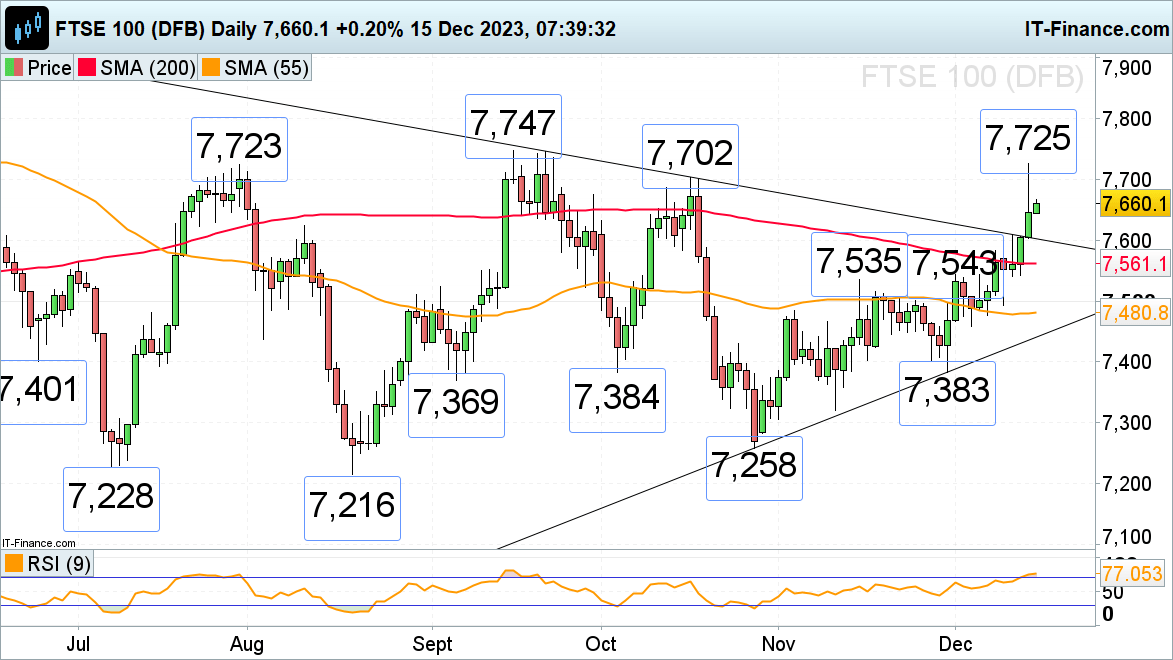
FTSE 100 short-term tops out
The FTSE 100 briefly made a near three-month high at 7,725 on Thursday as risk-on sentiment prevailed amid brought forward rate cut expectations in the US from May to March of next year with a total of 150 basis points of cuts priced in by the markets. Later in the day, the UK blue chip index gave back more than half of its intraday gains, though, after it became known that three of the nine voting Bank of England (BoE) Monetary Policy Members (MPC) wanted to see another rate hike while six voted to keep UK rates where they are.
Though the European Central Bank (ECB) also held its rates steady, its president Christine Lagarde said interest rate cuts had not been discussed during the meeting, leading to profit-taking in European equity indices.
Resistance for the FTSE 100 can now be spotted around the 7,687 to 7,702 October highs ahead of Thursday’s 7,725 and the September 7,747 highs.Minor support below the 10 August high at 7,624 comes in along the breached September-to-December downtrend line, now because of inverse polarity a support line, at 7,602.
FTSE 100 Daily Chart

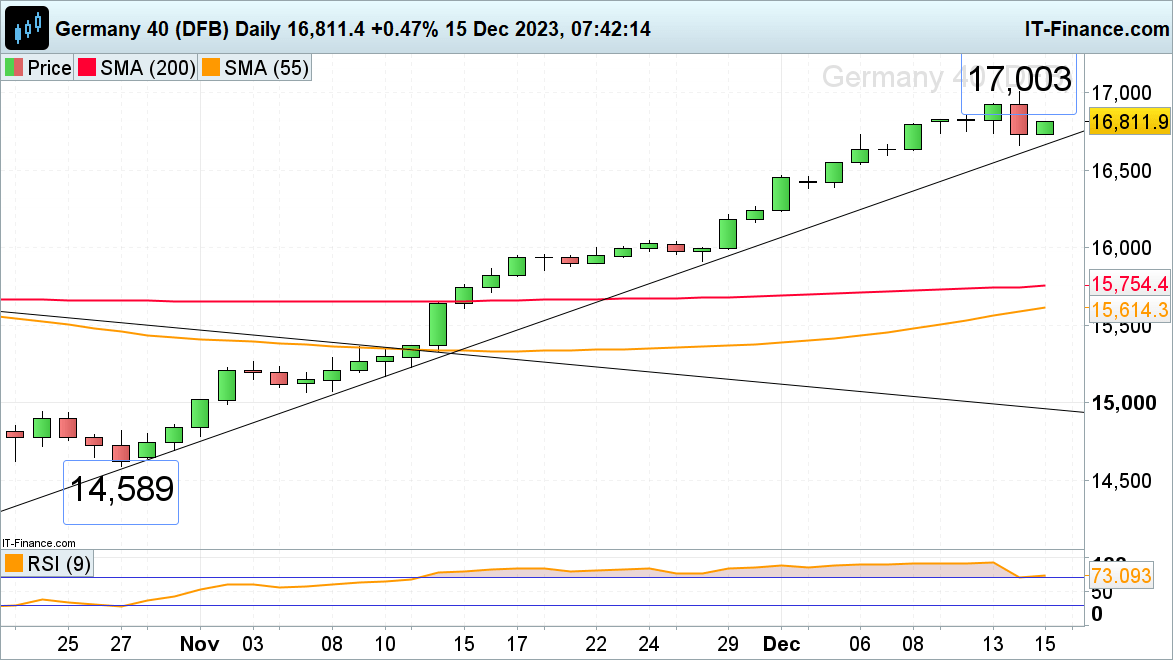
DAX 40 comes off new record high around the 17,000 mark
The DAX 40’s strong advance from its October low over six consecutive bullish weeks stalled around the minor psychological 17,000 mark as the ECB said that rate cuts were not discussed at its monetary meeting, prompting some profit taking and a slip to 16,661 for the index.
The German stock index remains above its October-to-December uptrend line at 16,664, though, which should act as support. As long as it does, Tuesday’s high at 16,853 may well be revisited. Further minor resistance sits at Wednesday’s 16,928 high.
DAX 40 Daily Chart
See how daily and weekly sentiment changes can affect price action
| Change in | Longs | Shorts | OI |
| Daily | 36% | 4% | 11% |
| Weekly | 4% | 6% | 6% |
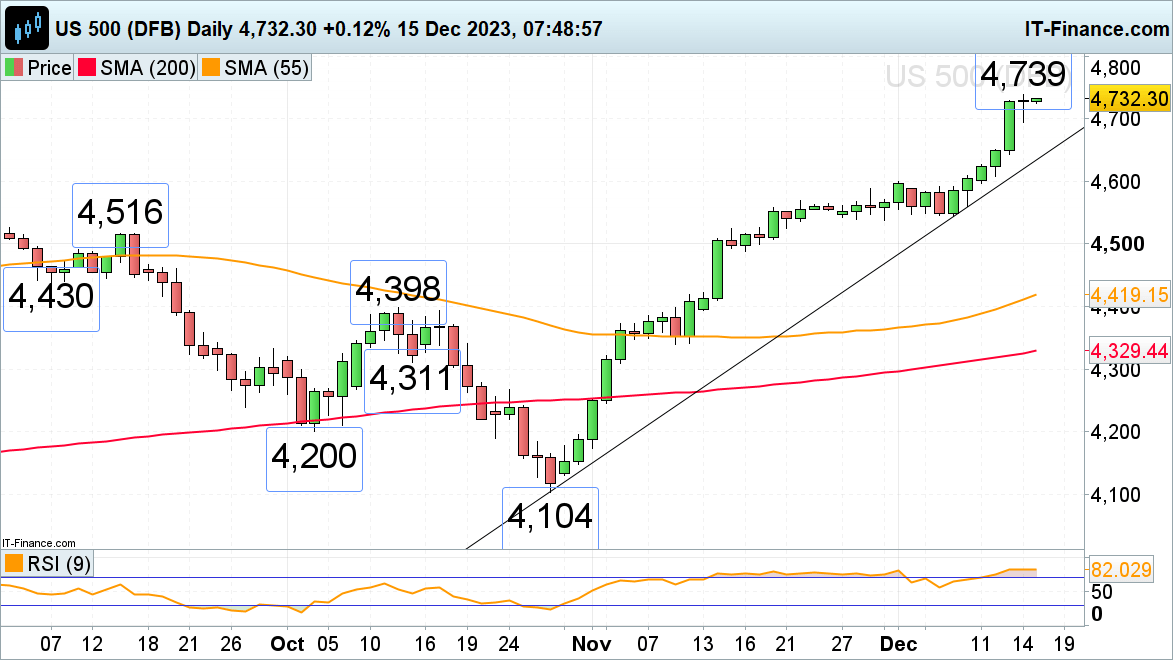
S&P 500 surges ahead
The S&P’s steep advance on rate cut expectations is beginning to lose upside momentum around the 4,739 mark but remains intact while Thursday’s low at 4,694 holds. On Friday volatility is expected to flare up again as 'triple witching' of $5 trillion in expiring options collides with index-rebalancing of the S&P 500 and the Nasdaq 100.
Below 4,694 the March 2022 peak at 4,637 could act as support. While the last couple of weeks’ lows at 4,544 to 4,537 underpin, the medium-term uptrend stays intact.The index now targets the November and mid-December 2021 highs at 4,743 to 4,752 ahead of its record high made in January 2022 at 4,817.
S&P 500 Daily Chart