DAX 40, FTSE 100 and Dow Jones Industrial Average Talking Points:
- The Market Perspective: FTSE 100 Bearish Below 7,300; Dow Bearish Below 32,400
- The DAX 40, FTSE 100 and Dow Jones Industrial Average are among the most buoyant – relative to their ranges and record highs – of the world major indices
- A revived, broad ‘risk off’ move for the global markets could draw these measures down; but so too could a sense of moderation in mean revision


This morning’s global macro picture was shaken up with the unexpected news that the Bank of Japan (BOJ) has modestly tightened its monetary policy stance. This group was standing as the most reliable dove of the world’s largest policy setters, which carried no small weight behind the belief that groups like the Fed – who have reiterated their commitment to fight inflation – could still be strong-armed into a pivot by a market tantrum. That confidence will erode somewhat on this news. That said, this is not likely a fundamental charge that can keep the market’s running – especially through the holiday liquidity distortions ahead. A full-blown risk version can strike at any time and frequently comes through innocuous beginnings, but planning for the improbable without a potential skew is not good practice.
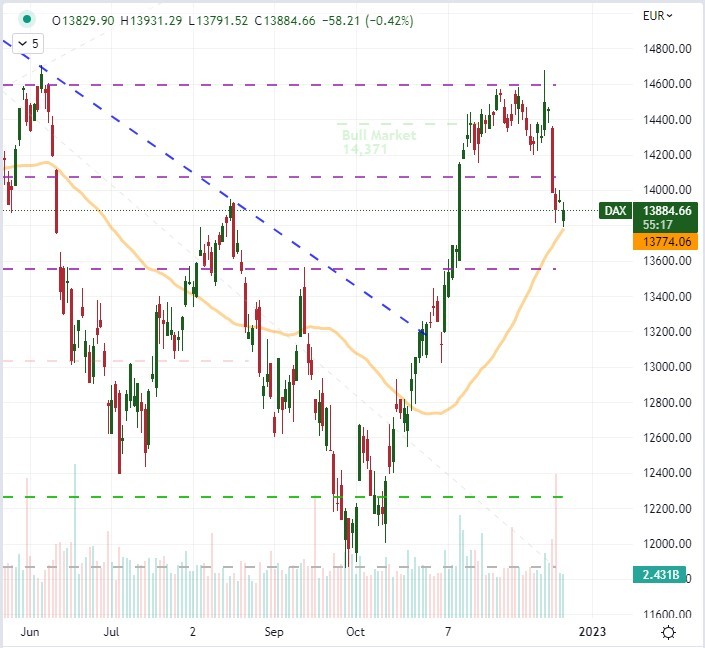
However, if we are shifting focus from macro-motivated momentum and volatility, then expectations for liquidity can be their own source of influence. Mean revision is one of the more natural of forces in the markets. That can happen in volatility terms, but it also manifests in price action as well. Consolidation, range and channels are usually an indication of markets that are normalizing. When it comes to Germany’s DAX 40, normalization looks to be a force that has pulled the index back into its broader range. The global slump that swept in back in February led to the break of 14,850 support, but the follow through was notably less productive than peers like the S&P 500. Resistance has solidified in the 14,600 area (the 61.8% Fib retracement of 2022’s range) ever since with the most recent test coming earlier this month. Immediate support is the 50-day simple moving average at 13,775 with the midpoint of the past three months’ range a little lower at 13,275. As far as returning to a mean, there may not be as much drift left – especially if there is the quintessential ‘Santa Claus’ rally ahead.
| Change in | Longs | Shorts | OI |
| Daily | -9% | 7% | 2% |
| Weekly | -27% | 9% | -5% |
Chart of DAX 40 with 50-Day SMA and Volume (Daily)

Chart Created on Tradingview Platform
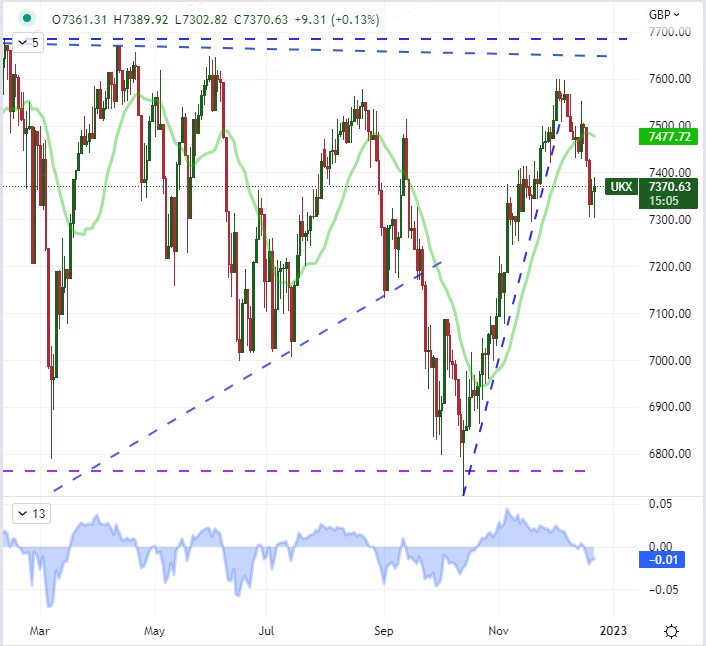
Where the DAX’s broad range is impressive, the FTSE 100’s own pattern has been even more persistent. The index has been trading between 6,800 and 7,700 for 18 months, eschewing much of the progress from other sliding risk-oriented assets through the first three quarters of 2022. It is particularly remarkable that the combination of recession warnings, higher interest rates, rampant inflation and the lingering effects of the UK’s disconnect with the Eurozone have not translated into more underperformance. Nonetheless, the market has held up and is only recently coming off the 7,600 – a little shy of the extreme upper threshold of the range. The swings in this particular index have been impressive but the throttling of liquidity may curb progress in the interim. Nevertheless, there is still room to reach to the midpoint of the most recent wave should moderation kick in.
| Change in | Longs | Shorts | OI |
| Daily | -30% | 25% | 2% |
| Weekly | -44% | 44% | 0% |
Chart of UK’s FTSE 100 Index with 20-Day SMA and 20-Day Disparity Index (Daily)

Chart Created on Tradingview Platform
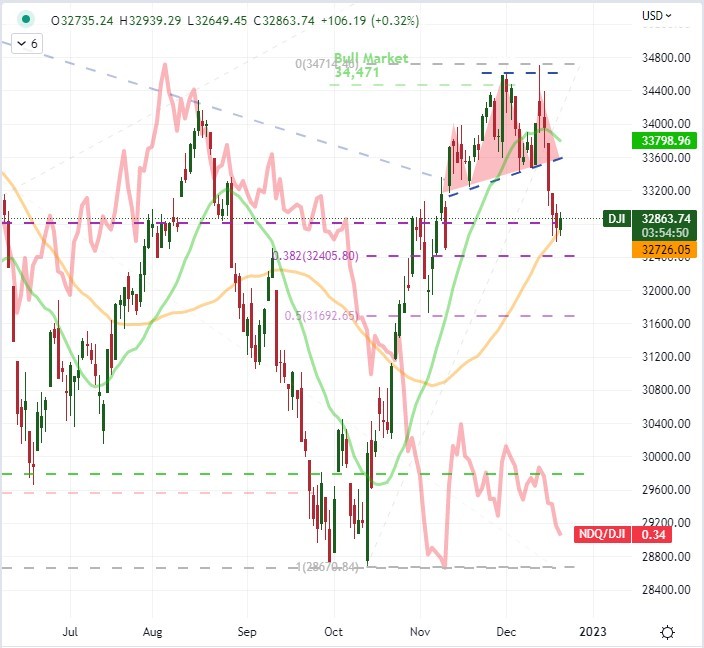
With the seismic waves spreading out from the BOJ slowing as the they crashed into the European markets, they were barely a rumble when the US indices came online. Among the top three benchmarks I monitor regularly in New York trade, the blue chip Dow has done the most to align to its European counterparts. The index managed to close above 34,471 at the end of last month to officially secure a ‘bull market’ designation. Yet, the down sweep of the past week after the run of US event risk (CPI, FOMC and PMIs) has nevertheless prompted a head-and-shoulders breakdown. The Dow is now positioned above its 50-day SMA and has yet to surpass even its 38.2% Fib of the past two months’ range. Notably, the Nasdaq 100 to Dow ratio, which I monitor as a gauge for risk appetite with the US equity market overall, never really recovered with the October charge.
| Change in | Longs | Shorts | OI |
| Daily | -18% | 18% | 7% |
| Weekly | -19% | 14% | 4% |
Chart of Dow with 20 and 50-Day SMAs, Overlaid with Nasdaq-Dow Ratio (Daily)

Chart Created on Tradingview Platform
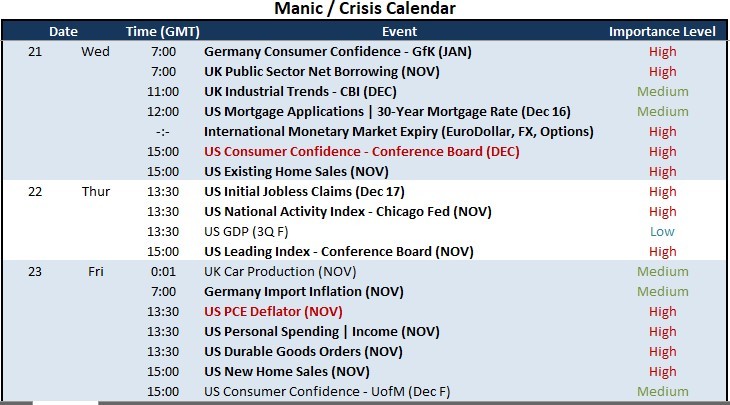
Looking for volatility through the end of this week, the docket is not particularly dense across these three markets. The DAX will draw on the least scheduled motivation. Setting aside the unpredictable (and uneven) messaging from ECB officials possible ahead, the schedule doesn’t have much in the way of key Eurozone event risk and the German docket only carries GfK Consumer Confidence and import inflation. The UK docket is second in this list with the CBI’s industrial trends report and net borrowing from the public sector. Far and away the most loaded of the calendars will be that of the United States’. There are a range of events listed with the US consumer confidence survey from the Conference Board tomorrow and the Fed’s favorite inflation report, the PCE deflator, on Friday. It remains to be seen how much impact a high-level report like that has so late in the day for liquidity.
Chart of Major US, UK and German Macroeconomic Event Risk Through Week’s End

Calendar Created by John Kicklighter


