Article by IG Senior Market Analyst Axel Rudolph
FTSE 100, CAC 40, Nasdaq 100 Prices and Charts

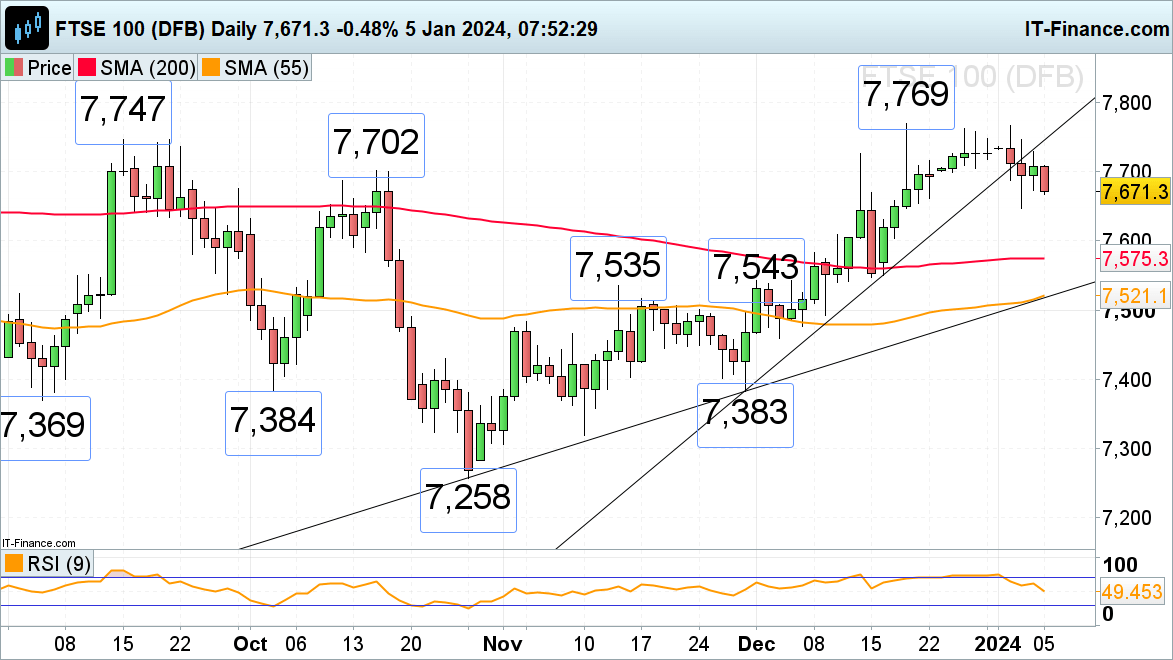
FTSE 100 follows Asia lower
The FTSE 100 continues to sell-off amid pared back rate cut expectations and despite UK house prices rising for the first time in eight months according to the Halifax. Wednesday’s low at 7,648 is thus back in sight, a fall through which could lead to the mid-October low at 7,584 being reached, together with the 200-day simple moving average (SMA) at 7,575.
Immediate downside pressure should be maintained while Friday’s intraday high at 7,709 isn’t bettered. Above it lies resistance between the September and December highs at 7,747 to 7,769.
FTSE 100 Daily Chart
| Change in | Longs | Shorts | OI |
| Daily | 15% | 4% | 6% |
| Weekly | 10% | 33% | 28% |
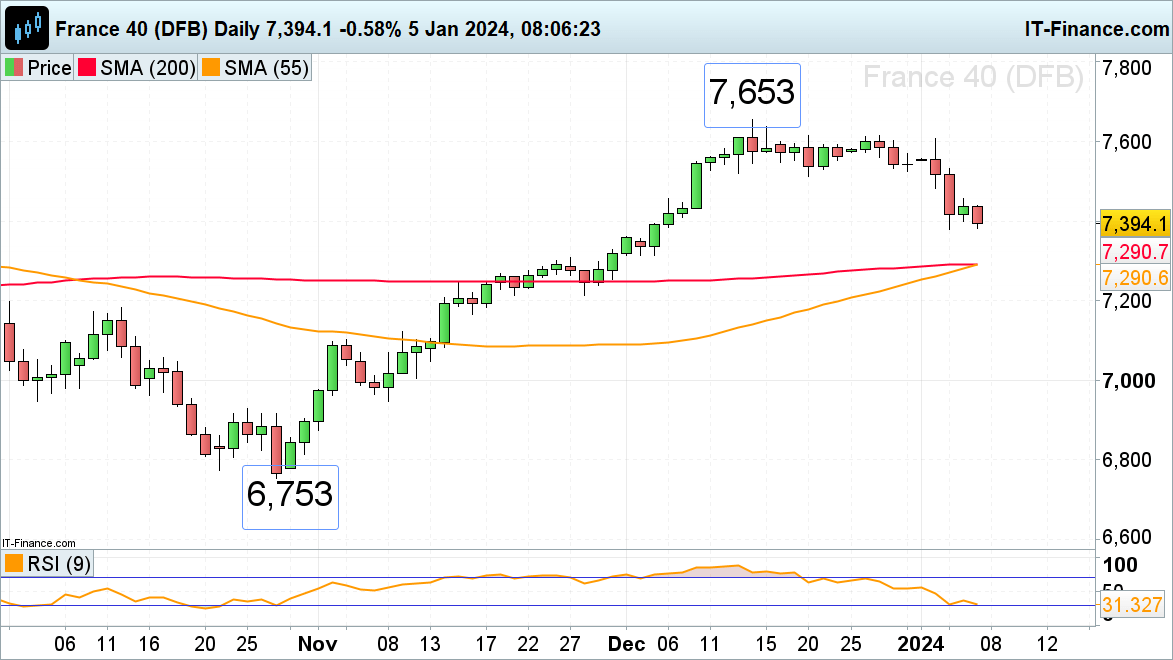
CAC 40 drops towards this week’s low
The French CAC 40 stock index continues to slide amid general de-risking on pared back rate cut expectations and is about to fall through this week’s low at 7,380 ahead of the publication of today’s Eurozone inflation data.
Were 7,380 to give way, the November high and 5 December low at 7,313 to 7,308 would be targeted. Minor resistance above Friday’s 7,438 intraday high sits at Thursday’s 7,456 high. This level would need to be exceeded for the next higher Tuesday low at 7,482 to be back in focus.
CAC 40 Daily Chart
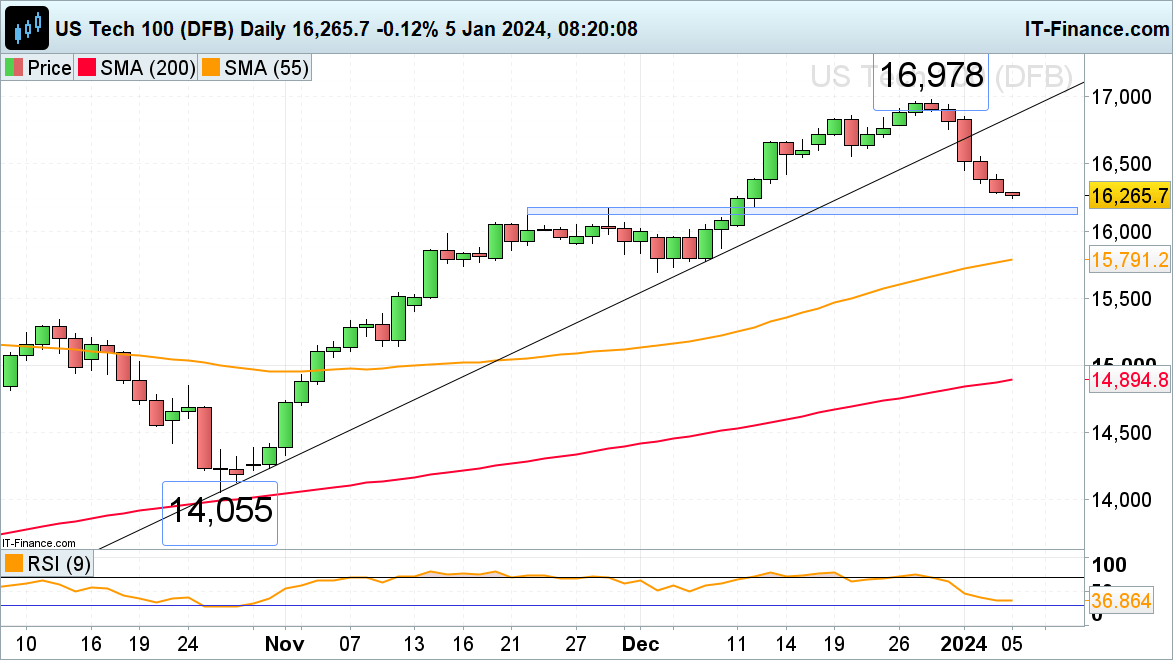
Nasdaq 100 drops for fifth consecutive day
The Nasdaq 100’s decline at the beginning of this year on lowered rate cut expectations and general risk-off sentiment due to heightened tensions in the Middle East led to five consecutive days of losses in the index, not seen since 2022.
The November high at 16,167 represents the next downside target and, together with the 22 November high at 16,126, should offer at least interim support. Resistance above Wednesday’s 16,353 low sits between Tuesday’s low and Wednesday’s high at 16,450 to 16,555.
Nasdaq 100 Daily Chart