


US Dollar Talking Points:
- This afternoon brought the release of FOMC minutes from the November rate decision.
- The US Dollar pulled back from yesterday’s breakout, testing support at prior resistance ahead of the minutes release.
- The analysis contained in article relies on price action and chart formations. To learn more about price action or chart patterns, check out our DailyFX Education section.

The US Dollar started the week with strength, breaking out from the short-term ascending triangle that I had highlighted in this week’s forecast. The break happened even before the US market could open on Monday and prices in DXY continued to move-higher as both EUR/USD broke down and USD/JPY broke out.
But that move was met with pullback in the early-portion of today’s trade, with prices pulling back to test support at prior resistance. This is the same spot that was highlighted for the ascending triangle, spanning from the Fibonacci level at 107.08 up to the swing-high at 107.27.
The release of FOMC meeting minutes from the November rate decision appeared to give the Greenback a slight boost upon their release, although there was little by way of continuation and 30 minutes after the release, the net is a mild bullish response in DXY, with price holding in the same area of support as taken from prior resistance.
US Dollar Two Hour Price Chart
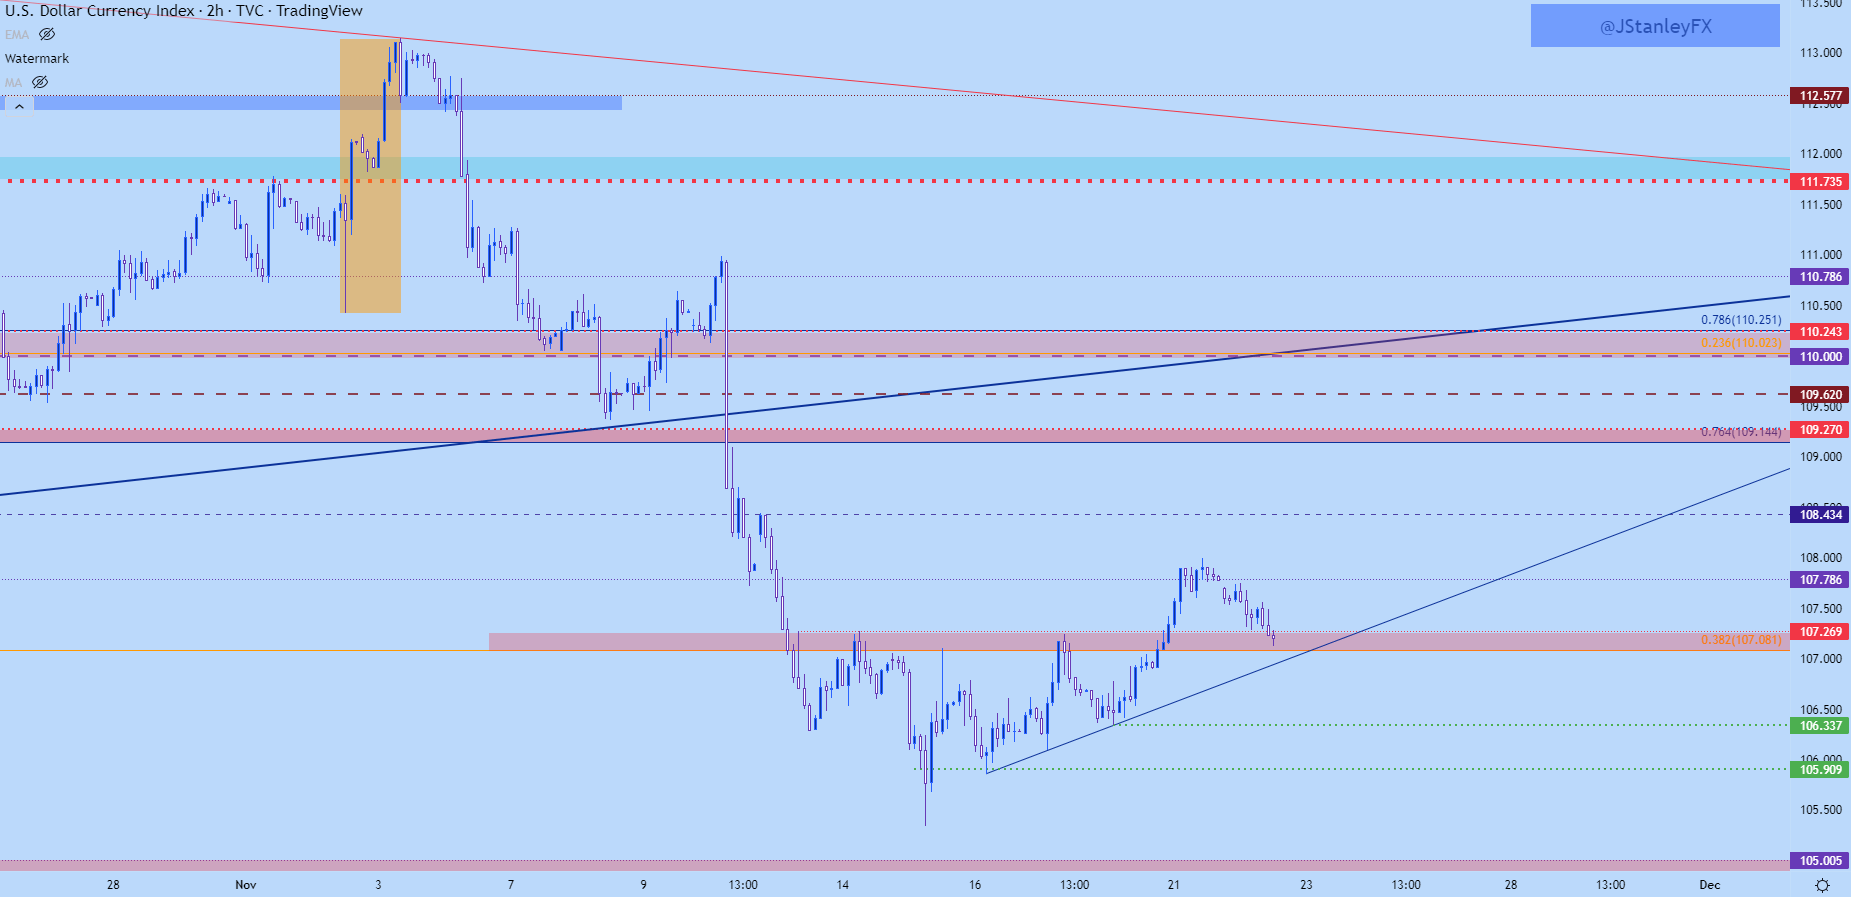
Chart prepared by James Stanley; USD, DXY on Tradingview
DXY: From Short to Long-Term
The reason this short-term observation is so key is what it might mean to the longer-term setup. I had looked at this in this week’s USD forecast and given the response in DXY last week, there’s possibility that a bottom is now in place. The first step of that process would be satisfied, at least, with last week’s extended underside wick. But that would then need to be met with follow-through, which started to show this week with the short-term breakout.
Now, the big question is whether bulls can hold the move and price holding higher-low support is key for this scenario to continue. With that said, price could push below this zone while still retaining bullish potential: But ideally buyers’ motivation is so great that they won’t allow for such to happen. But, at this point we have to let price make its move first.
From the four-hour chart below, I’m adding in a couple of additional levels of interest. The prior higher-low before the breakout was at 106.34 and if buyers can hold support above that level, the sequence of higher-highs and lows could continue. On the underside of price action, it’s the 105.91 level that sticks out and if sellers pose a breach of that level, the possibility of a fresh low increases and that puts focus on the confluent area around the 105.00 handle.
On the topside of price action, price has already hit the first targeted level from the breakout that was at 107.79. The next spot of resistance potential is around 108.43, after which the 109.14-109.27 area comes into play.

US Dollar Four-Hour Price Chart
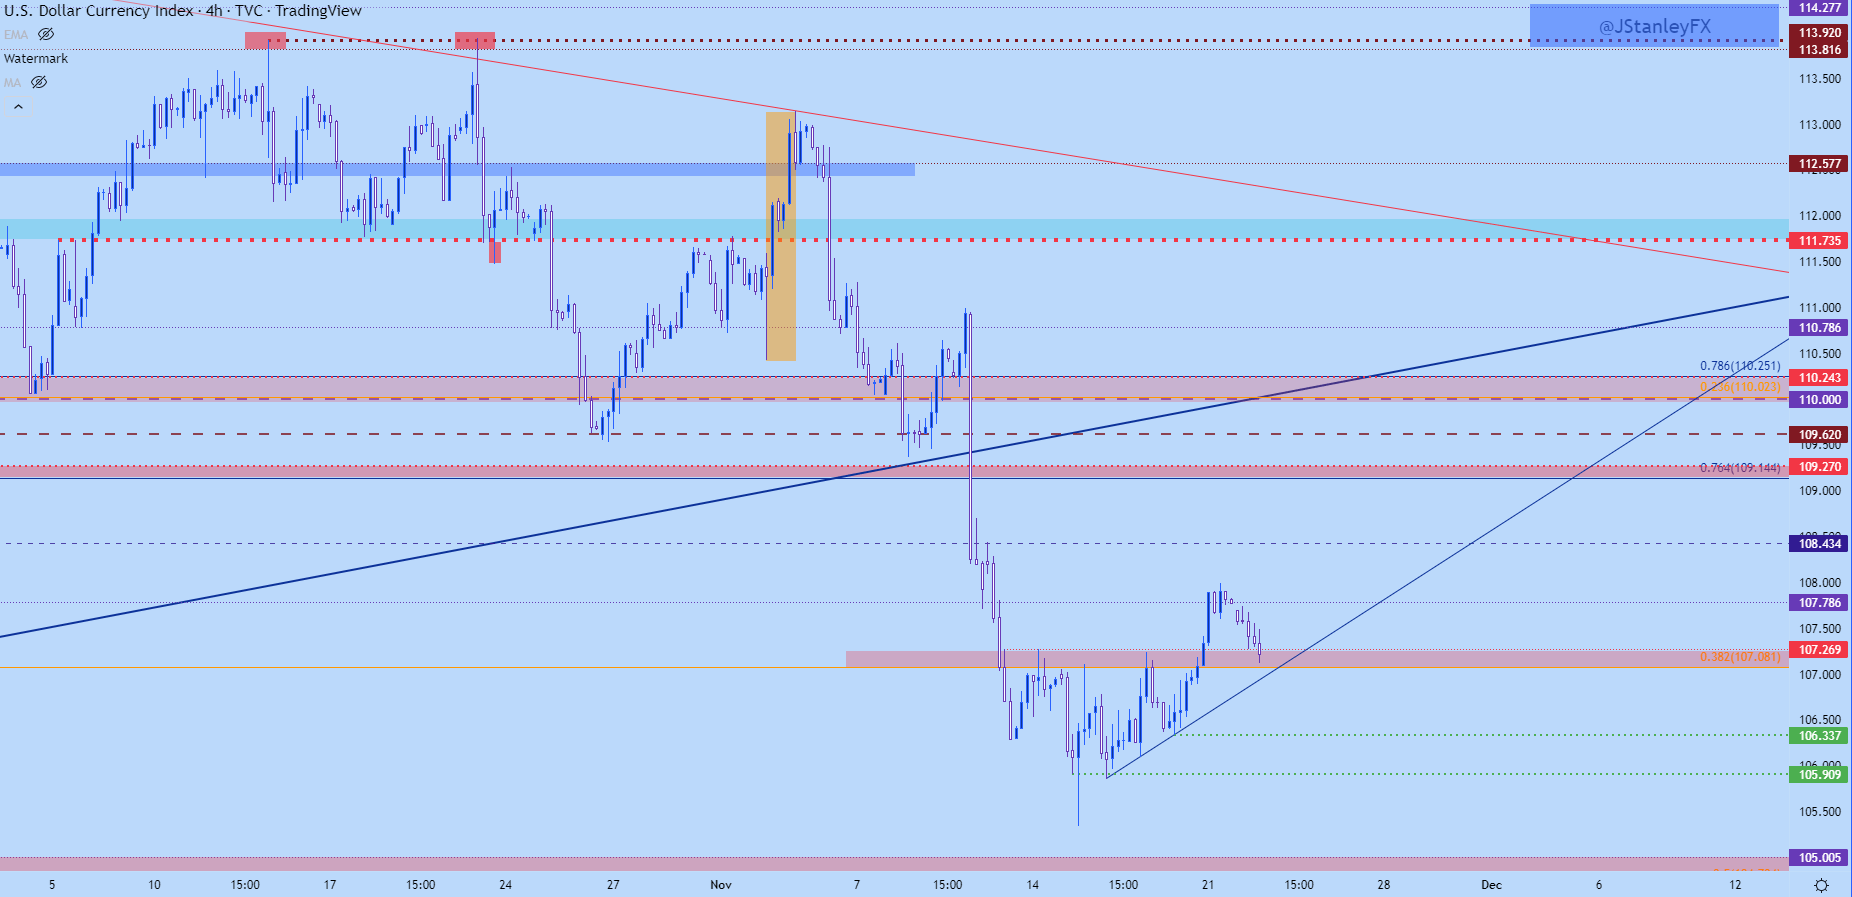
Chart prepared by James Stanley; USD, DXY on Tradingview
EUR/USD
The Euro is 57.6% of the DXY quote so if the US Dollar is going to strike out on any fresh trends, it’ll likely need at least some participation from the Euro.
I had written about EUR/USD a little earlier today, highlighting a setup of resistance at a key spot on the chart. This is around the same 1.0282 level that I’ve been working with that’s the 38.2% Fibonacci retracement of the February-September sell-off. Perhaps more importantly, this helped to set last week’s low on two separate tests, finally succumbing to selling pressure in early trade this week.
If a true bottom is in-place in the USD, we’re likely going to need to have seen a top posted in EUR/USD. I had touched on that topic last week and again in the forecast for USD coming into this week. Price is currently above that 1.0282 level, but a push back-below re-opens the door for EUR/USD bears and USD bulls. If prices don’t push through that support level, resistance potential also exists at the familiar 1.0350 spot on the chart.
EUR/USD Four-Hour Chart
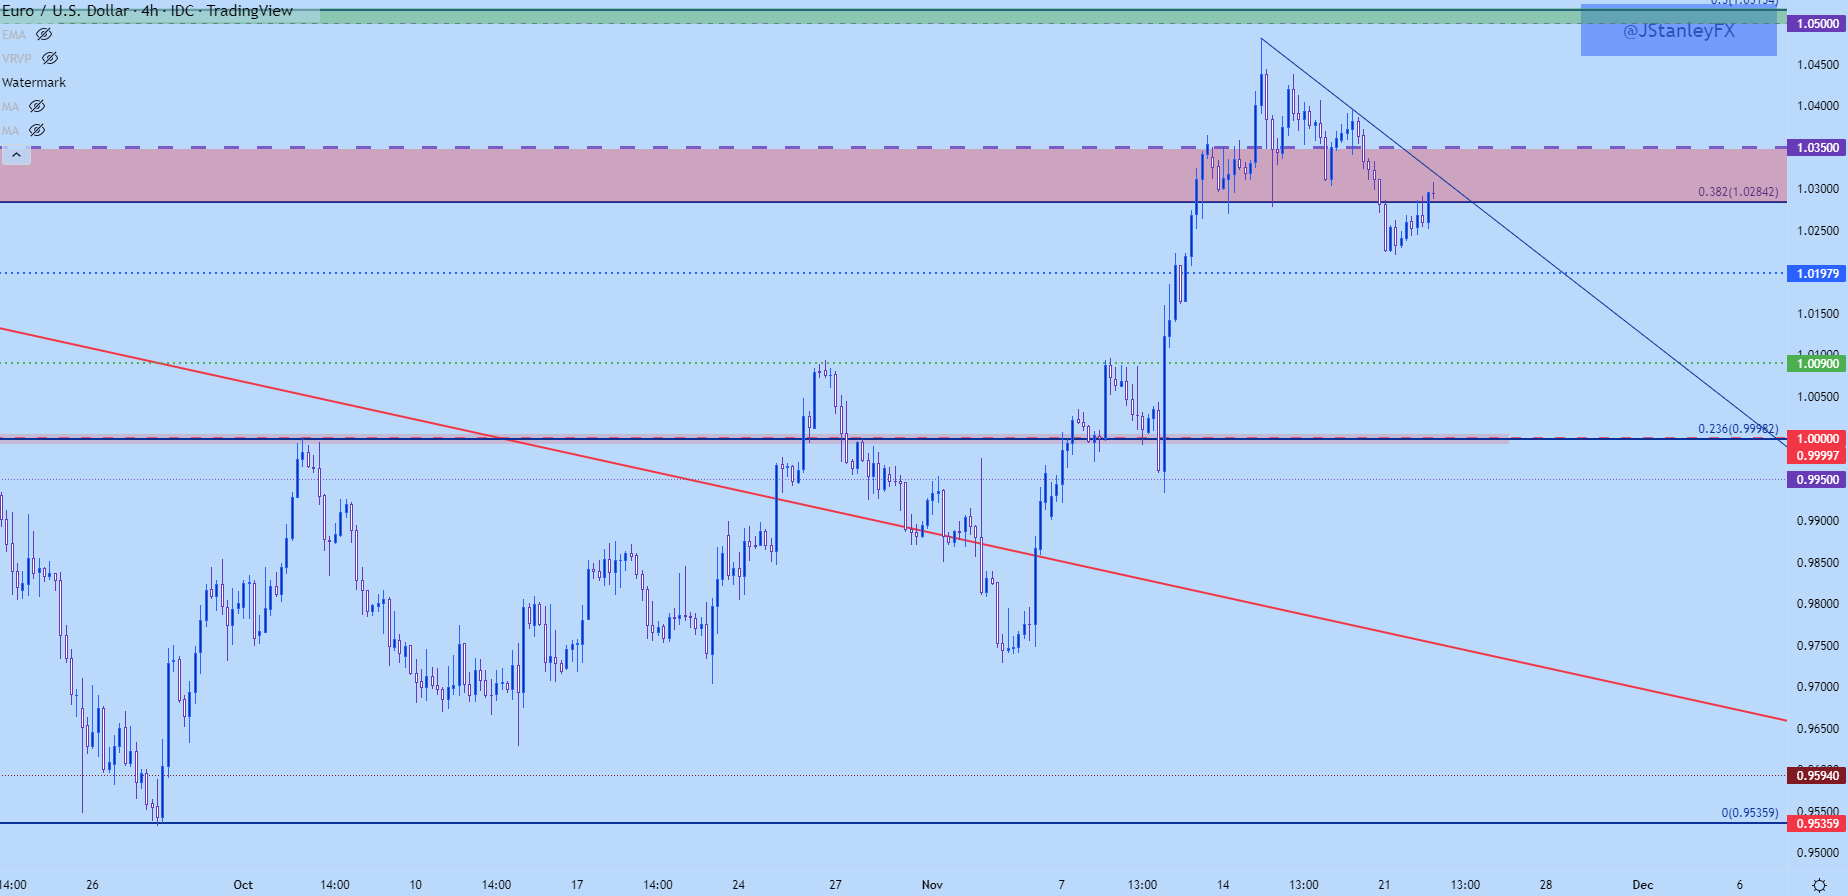
Chart prepared by James Stanley; EURUSD on Tradingview
USD/JPY
I had looked into the Yen yesterday, highlighting a similar ascending triangle breakout in the USD/JPY pair that mirrored the look in DXY.
Similarly that move has pulled back but, notably, that pullback has been more mild or shallow than what showed in DXY above. This hints at additional Yen-weakness which could make the pair as an attractive candidate if we do see the bigger-picture trend of USD strength return. Or, alternatively, that could be adapted elsewhere, such as GBP/JPY as I had looked at yesterday.
In USD/JPY, I’m tracking the prior resistance zone from 140.30 up to 140.80; and there’s even a case to be made for support at the 140.00 psychological level.
USD/JPY Two-Hour Price Chart
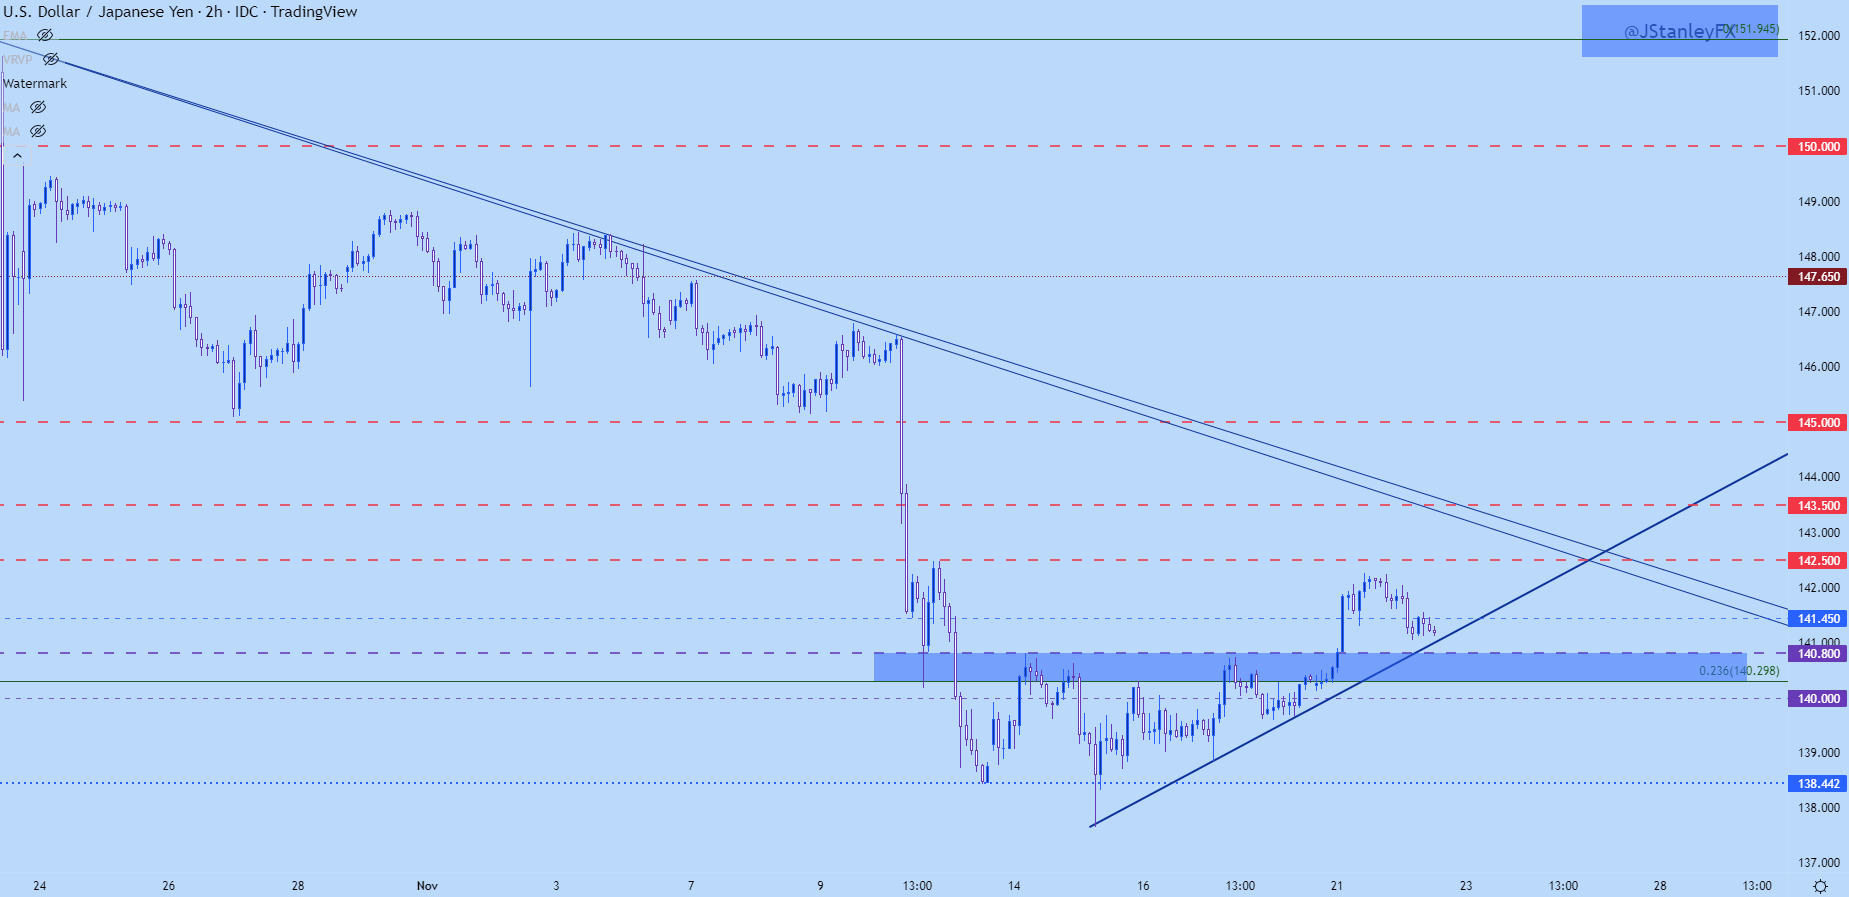
Chart prepared by James Stanley; USDJPY on Tradingview
USD/CAD: Perhaps Something for USD Bears
On the other side of the Greenback, USD/CAD may be of interest. I had highlighted a major area of resistance sitting overhead in USD/CAD and that quickly came into play as USD-strength ran to start this weeks’ trade. The zone runs from a Fibonacci level at 1.3465 up to the 1.3500 psychological level.
As I had written coming into this week, “This keeps the door open for bullish trends inUSD/CAD. There’s a large area of resistance sitting overhead at the 1.3465-1.3500 area. This was support in October and early-November, so the next push up to resistance in that area could be looked to for pullback potential, after which higher-low support potential comes back into the equation.”
So, we have the resistance test and we now have the pullback: The big question is whether bulls show up at support or whether price continues to sink. For support, I’m tracking a confluent area between a couple of Fibonacci levels that runs from around 1.3338-1.3345.
USD/CAD Four-Hour Price Chart
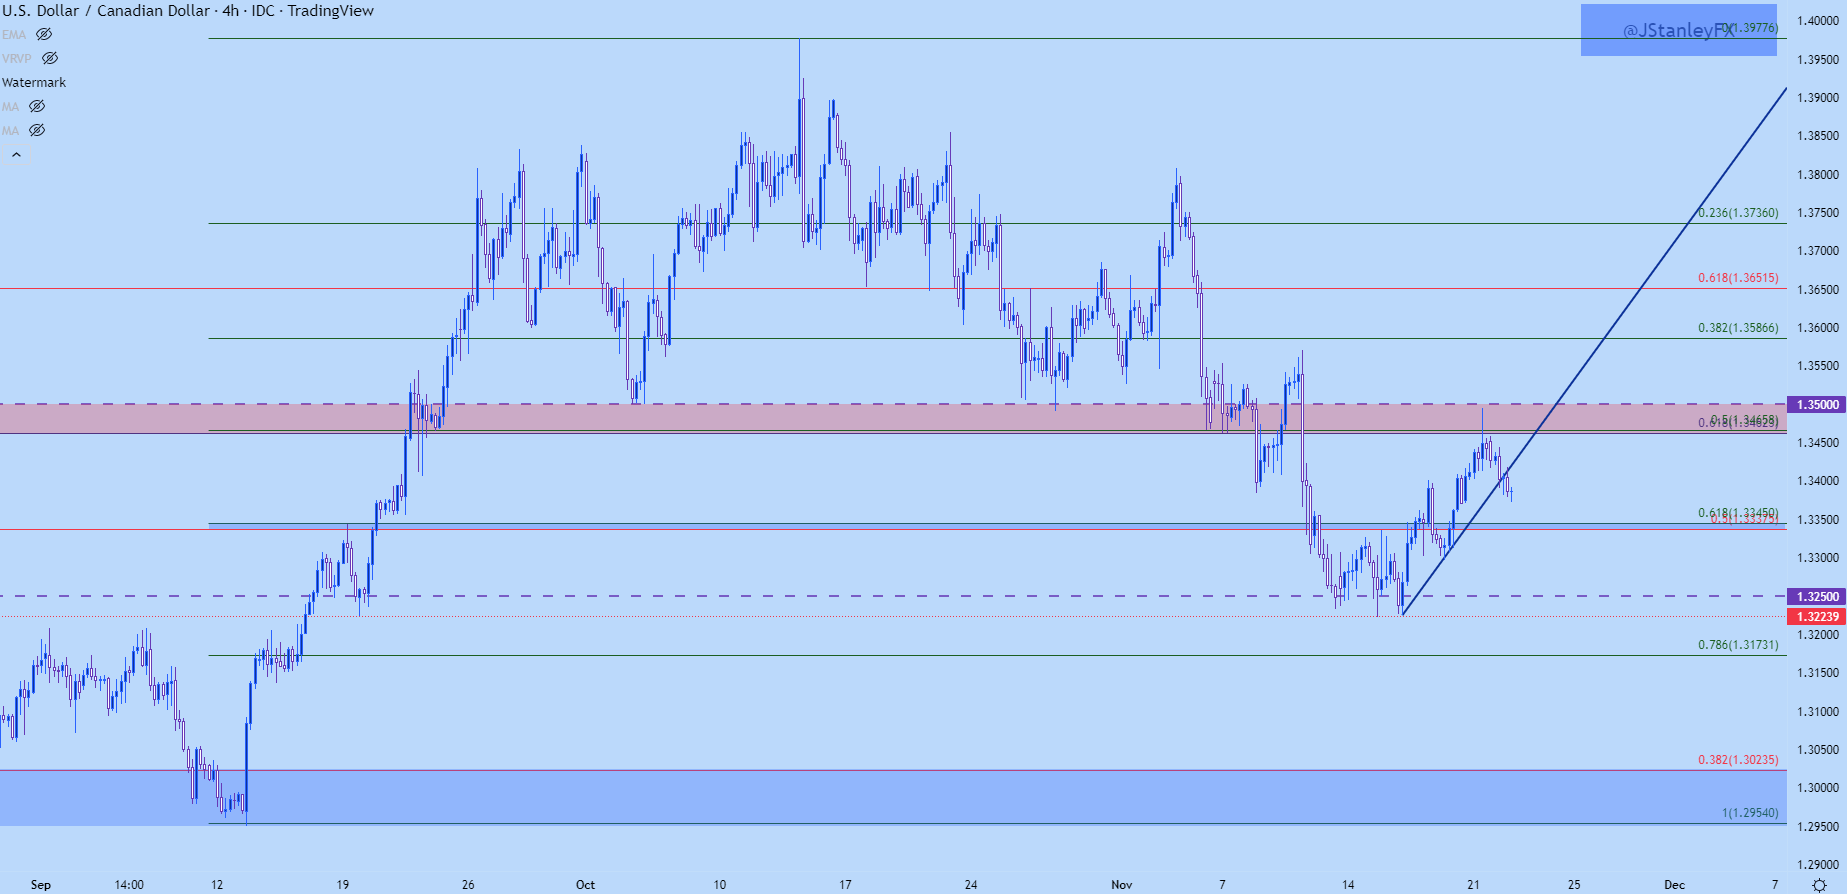
Chart prepared by James Stanley; USDCAD on Tradingview
--- Written by James Stanley, Senior Strategist, DailyFX.com & Head of DailyFX Education
Contact and follow James on Twitter: @JStanleyFX


