


KEY POINTS:
- Low Liquidity and Volatility Could Limit Upside Potential and Keep EUR/USD Rangebound.
- Ascending Channel Provides a Host of Opportunities.
- Four-Hour and Two-Hour Charts Provide Alternative Scenarios.
- To Learn More About Price Action, Chart Patterns and Moving Averages, Check out the DailyFX Education Section.

EUR/USD OUTLOOK
The Euro Area has seen continued improvement in data releases of late evidenced by this morning’s upbeat German IFO survey on Business Climate. The Euro has gained 11% against the greenback since the end of September while printing a multi-month high around 1.0734 last week. The improving data coupled with the ECB’s somewhat hawkish pivot last week, a case could be made for continued EUR/USD appreciation.

As we enter the holiday period however, we should see a notable drop in liquidity and volatility. This in turn could increase the possibility that EUR/USD may remain rangebound within the ascending channel, while a break of the channel also remains viable. Let’s take a look at potential opportunities that may arise from the different scenarios playing out.
TECHNICAL OUTLOOK
From a technical perspective, the EUR/USD weekly candle close could be a sign of bulls losing momentum as the pair struggled to maintain gains above the 1.0700 handle.
EUR/USD Four-Hour Chart – December 19, 2022
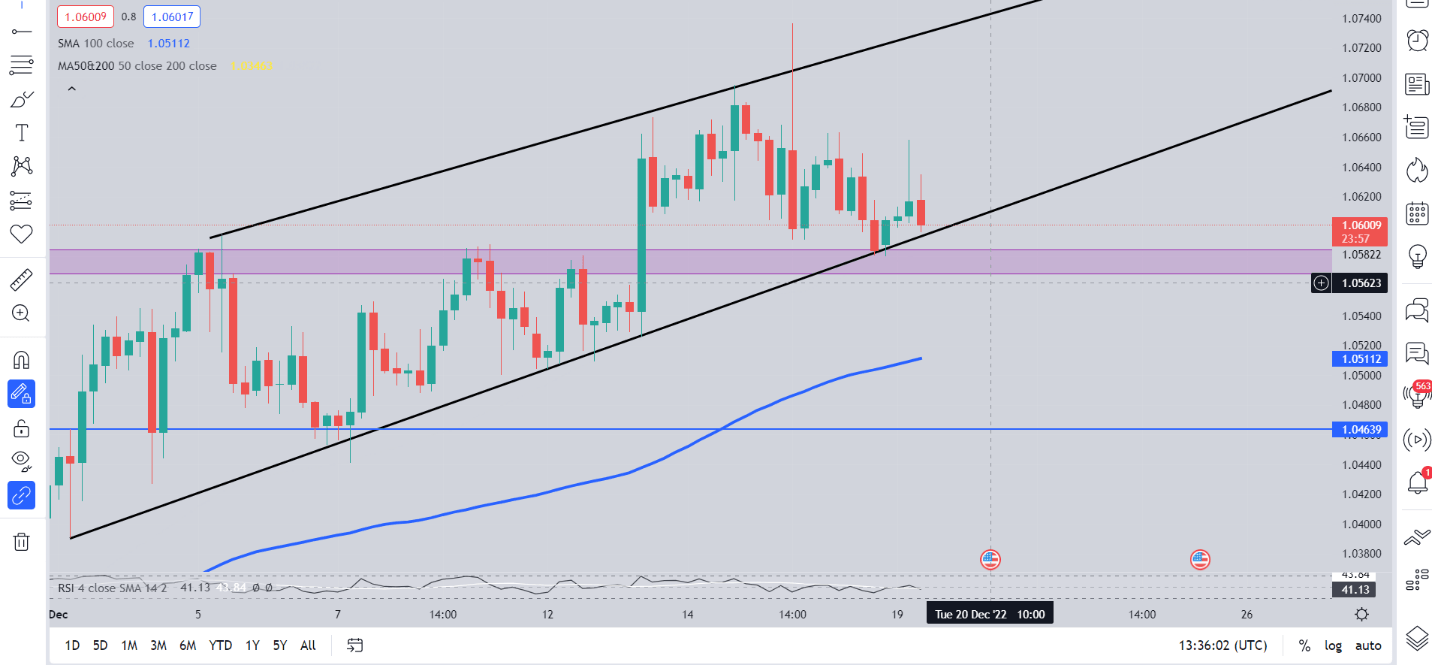
Source: TradingView
Friday’s daily candle as a marubozu candlestick hinting at further downside ahead. The 4H has been printing lower highs and lower lows eyeing a break of the ascending channel. Should we see a break and 4H candle close below the ascending trendline as well as the support area around 1.0580-1.0600 we could see a deeper retracement. The first support area will be around the 1.0500 handle which currently lines up with 100-day MA with a break below opening up a retest of the 200-day MA resting around the 1.0350 area.
EUR/USD Two-Hour Chart – December 19, 2022
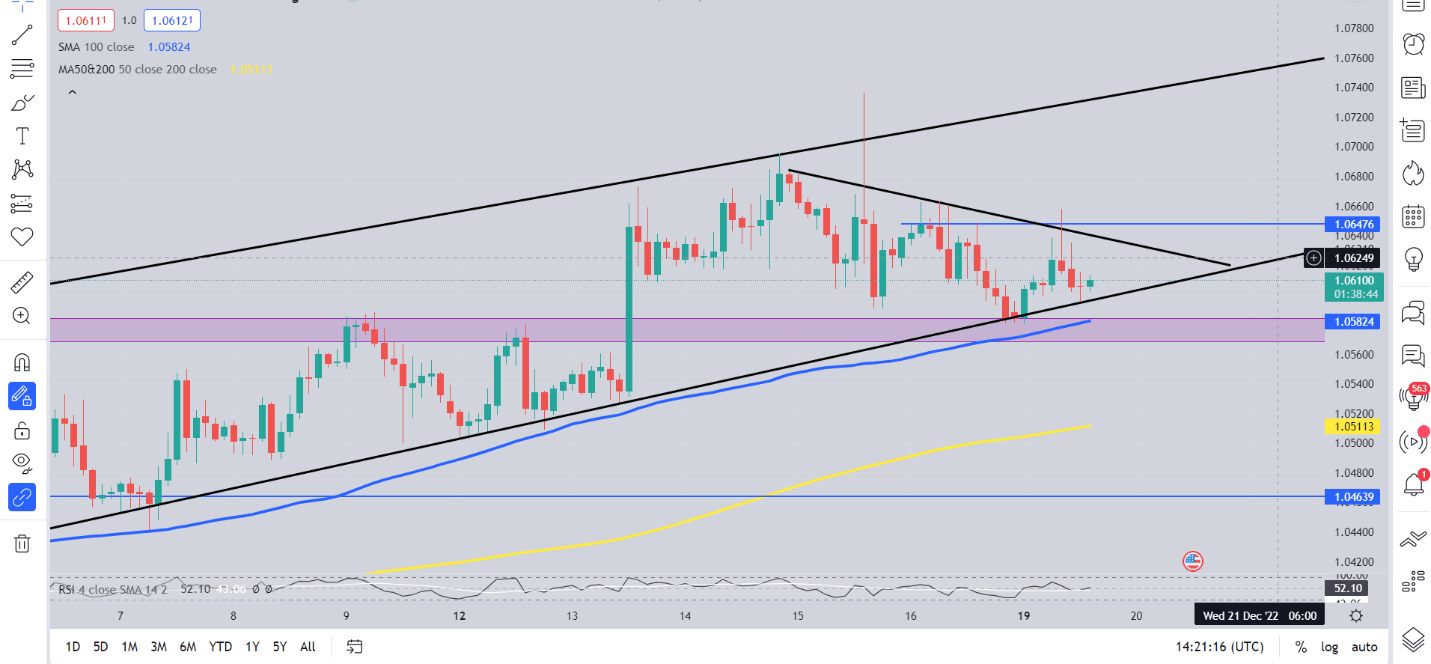
Source: TradingView
On the two-hour chart we may find an alternative scenario, with EUR/USD looking like it may bounce from the support area around the 1.0580-1.0600 level and break the descending trendline which could lead to a 120-pip upside rally. As you can see on the 2H chart above the 100-day MA rests at 1.0580 which could push the pair higher and threaten the recent high around 1.0734.
Both scenarios remain viable at this stage with price action and the US dollar index likely to drive EUR/USD ahead of the New Year.

IG CLIENT SENTIMENT: BEARISH
IG Client Sentiment Data (IGCS) shows that retail traders are currently SHORT on EUR/USD with 57% of traders currently holding short positions. At DailyFX we typically take a contrarian view to crowd sentiment, and the fact that traders are SHORT suggests EUR/USD prices may continue to rise.
Written by: Zain Vawda, Market Writer for DailyFX.com
Contact and follow Zain on Twitter: @zvawda


