


Nasdaq 100, Dollar, EURUSD, NFPs and Recession Talking Points:
- The Market Perspective: USDJPY Bullish Above 132.00; EURUSD Bearish Below 108
- Spurred on by the dovish interpretation of the Fed and Meta earnings the previous day, the Nasdaq 100 and S&P 500 charged Thursday…while the Dow closed lower
- A strong Dollar with EURUSD reversal defied fundamental convention of risk trends and Fed throttling, how will the currency respond to NFPs and the ISM report Friday?

Risk appetite seemed to have found serious purchase this past session for benchmarks like the S&P 500, but the charge was noticeably uneven. With a questionable backdrop for the bulls, a stumble in earnings afterhours Thursday night and some key event risk ahead; traders should take stock of the discrepancy. First, let’s indulge the boiled down bullish perspective. With gains already accumulating in certain speculative corners this past month, the Federal Reserve’s decision Wednesday with a smaller 25 basis point rate hike and reference to the ‘disinflation process’ scratched a common itch for the investors that had grown used to central banks catering to their whims over the past decade. The more than 20 percent charge from Meta shares after the company’s earnings seemed to further add fuel to the fire. However, through all of that, the ‘blue chip’ Dow Jones Industrial Average seemed wholly unimpressed. Compared to the S&P 500’s 1.5 percent advance and Nasdaq’s 3.6 percent surge, the Dow closed 0.1 percent lower after a session that was hardly ever green on the day. We could chalk this up to an outlier, but it wasn’t the only risk benchmark I refer to that was struggling. Also, if there is a solid foundation to ‘risk on’, it would be unusual to see one of the world’s preferred sentiment measures not participate.
Chart of Dow Jones Industrial Average Overlaid with the Nasdaq 100 and S&P 500 (Daily)
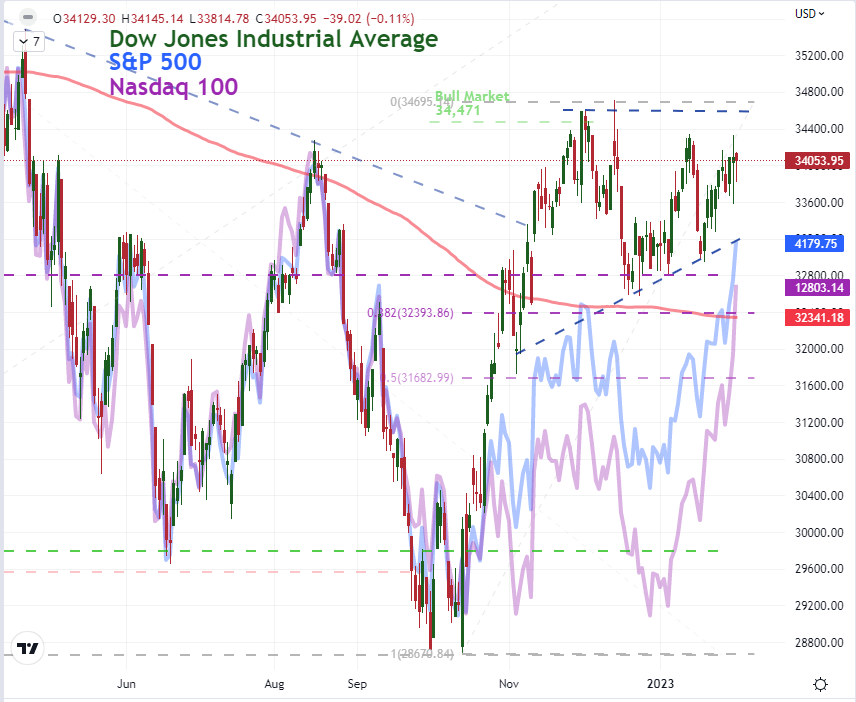
Chart Created on Tradingview Platform
Taking a different look at the backdrop on risk trends, I refer to one of my favorite internal measures below: the Nasdaq 100 to Dow ratio. This reduces the implications of equities and US markets, which can be overriding factors difficult to curb from a straight review of any of the individual indices. This pits a preferred ‘growth’ measure (it was the preferred vehicle before the meme and crypto phases) versus a more stoic ‘value’ index. As you’d expect from their divergent performances, the ratio experienced a massive surge this past session. In fact, the 3.7 percent charge was the second largest charge (after Mar 9th, 2021) from this comparison in the past two decades. And, while I don’t pay much attention to technicals on ratios (nor data series), this measure did happen to overtake its 200-day simple moving average (SMA) on the same day Apple, Amazon and Google all overtook their equivalent long-term trends. The earnings that we registered afterhours for the three were mixed at best with the largest (Apple at over $2 trillion market cap) a miss on both top and bottom line. We will see what happens to the tech sector in Friday trade, but this looks more likely a targeted reach for volatile and popular ‘risk’ measures rather than a bid for the overall market. While the bull trend could solidify, it is still an uneven foundation.
Chart of Nasdaq 100 to Dow Ratio with 200-Day SMA and 1-Day Rate of Change (Daily)
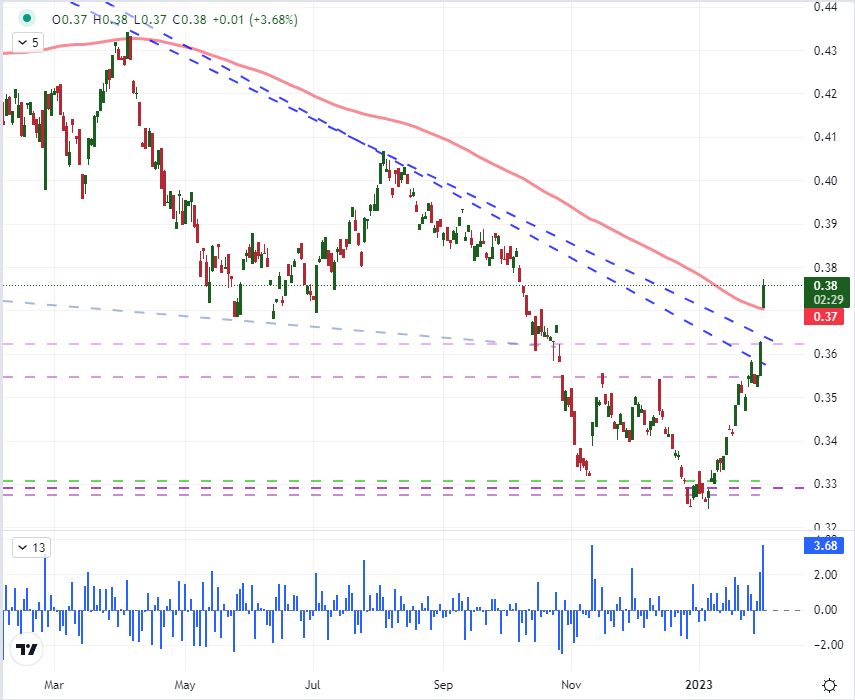
Table Created by John Kicklighter
Meanwhile, another interesting market discrepancy to the general expectation of risk appetite was the recovery from the US Dollar. The Greenback has a number of fundamental drivers, but its safe haven status seems to have drawn the most reliable correlation with the VIX slide lining up neatly to the currency. The volatility index did edge higher this past session even though the S&P 500 (from which it is derived) advanced. For the DXY Dollar Index, the day was a 0.6 percent gain – the biggest since the January 5th failed breakout – following the biggest gap lower since October 6th. Likely helping the Dollar’s case was the response to both the European Central Bank (ECB) and Bank of England (BOE) rate decisions. For the UK central bank, the 50 basis point hike met expectations, but the real response was to a similarly expected dovish outlook for a nearby cap on rates. The ECB hiked 50 basis points and made clear at least another similar move was ahead, but the Euro still dropped broadly. The US rate outlook through year end hasn’t changed much, so what theme will take up the reins to guide Dollar to its next leg: safe haven or carry benefactor?
Chart of EURUSD with 20-Day SMA and 1-Day Rate of Change (Daily)
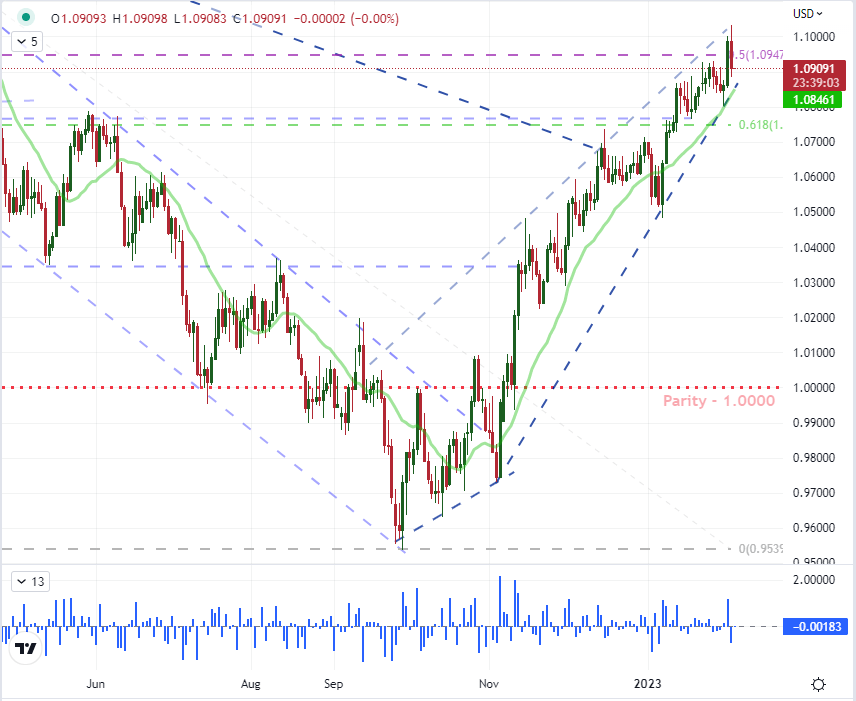
Chart Created on Tradingview Platform
As we head into the final trading session of the week, there is a lot of unresolved fundamental backdrop. The interpretation of global monetary policy is still unfolding in real time. The most distinct global macro impact of earnings this season will show through in Friday trade after the nearly $4 trillion worth of market cap from just Apple, Amazon and Google alone. If it can build a head of steam – bullish or bearish – it can exact a significant amount of control. Then there is also the implications of recession uncertainty. The IMF lifted its forecast earlier this week, but that hasn’t exactly absolved the market of its worry. For a top listing, the nonfarm payrolls (NFPs) will once again be dissected as the proxy for every fundamental discussion in the market. It will certainly generate a lot of headline space. However, my focus is on another indicator with better alignment to the state of the world’s largest economy: the ISM service sector report.
Top Global Macro Economic Event Risk for Next Week
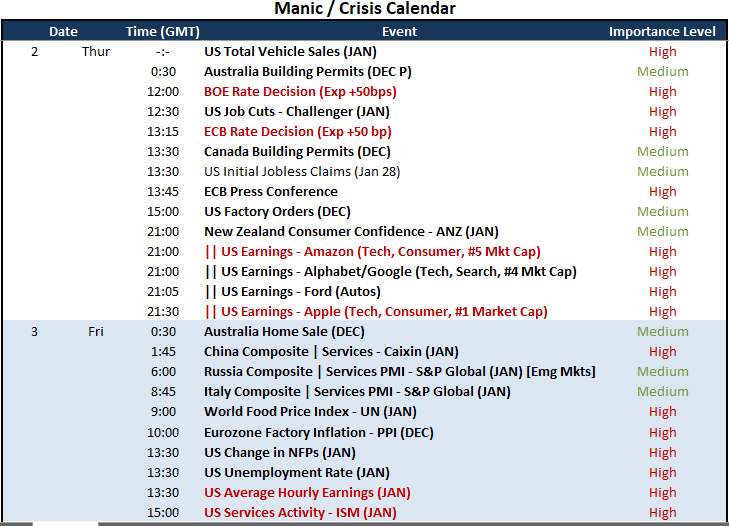
Calendar Created by John Kicklighter
The service sector in the United States accounts for approximately three quarter of the country’s output and employment. As such, there are few measures that are more closely aligned to its general economic health. Given that it is updated monthly, it is a more timely proxy of the biggest fundamental question in the market: economic strength. Notably, the service sector measure fell sharply in the last update to contractionary territory (a reading below 50.0) and the manufacturing report earlier this week extended its own slide. Forecasts are for a bump back above the 50.0 market (50.4 consensus), but there is probably more potency for a disappointment here.
Chart of S&P 500 with US Mfg and Service Activity, Overlaid with Official Recessions (Monthly)
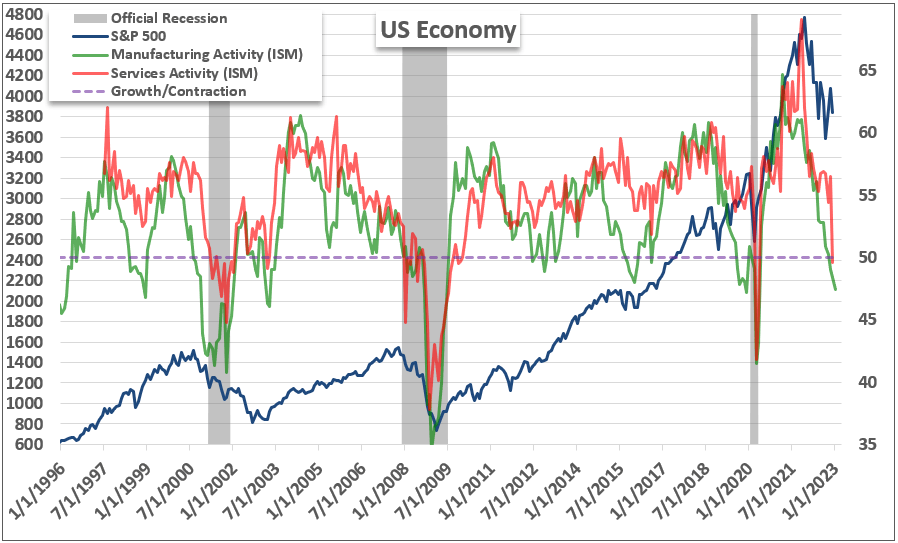
Chart Created by John Kicklighter


