


Dollar, Yields, Inflation and Gold Talking Points:
- The Market Perspective: DXY Dollar Index Range Bound from 105 to 103.25
- The FOMC meeting minutes reiterated its focus on inflation with a mention of wariness around ‘unwarranted’ easing in financial conditions
- Despite the Fed’s own forecasts for a peak rate above 5.00 percent benchmark and reiteration of no cuts in 2023, the markets continue to price in a more dovish view

There is plenty of scrutiny that can be cast upon the Federal Reserve in their forecasting abilities or their mix of monetary policy, but you can’t fault the clarity of their message. In the release of the minutes from the December 13th-14th policy meeting, the group stuck to the same talking points that they have individually expressed in speeches as well as through other official channels such as the Chairman’s last press conference following the rate decision itself. Once again, the minutes laid out inflations risks among the key factors they are monitoring. One only needs to consider that the word “inflation” was mentioned 103 times in the record to appreciate its importance. Adding to the weight being afforded price pressures, the statement noted that the group was concerned of an ‘unwarranted’ easing in financial conditions that could undermine their efforts to tame inflation.
In regards to policy actions moving forward, the group still seemed to support its view that further increases was necessary while the message that no rate cuts would be realized in 2023 was pointedly reiterated. The markets seem to be dubious on this hawkish front. Looking to the Dollar Index which is one of the most sensitive measures to US rate expectations, the market saw little material change in view through pricing. The DXY was still trading within its three week range between 105 and 103.40 awaiting a clear sense of conviction. This chop has frustrated more than a few major pairings, but EURUSD’s failure to sustain traction after breaking a channel floor around 105.80 was a notable rejection of fundamental focus.
Chart of DXY Dollar Index (60-Minutes)
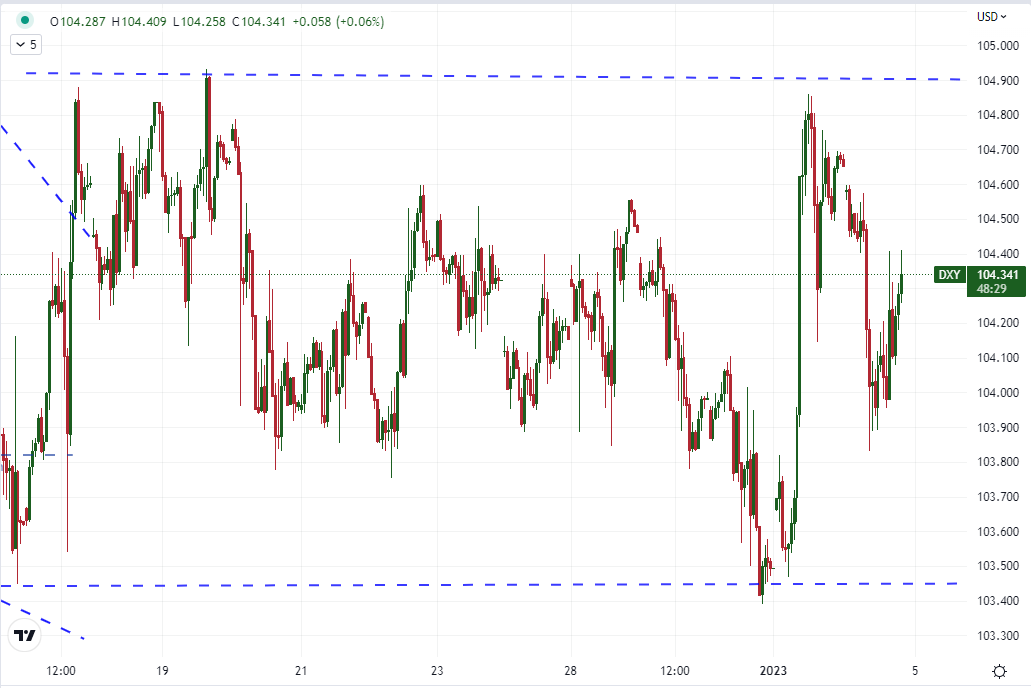
Chart Created on Tradingview Platform
Looking more directly to the market’s rate expectations through products that are principally priced on the particular matter, there was a very modest edge higher in US 2-year yields while Fed Fund futures for the February and June time frames (next FOMC meeting and expected ‘terminal’ period) were virtually unchanged. Looking to the Summary of Economic Projections (SEP) released with the policy decision last week, the Fed projected a 5.1 percent benchmark rate with 17 of 19 voters seeing the key rate above 5.0 percent by year’s end. Yet, from Fed Funds futures implied rates, we can see that the market continues to project a view that runs at a discount to those official forecasts. History suggests that the Fed’s forecasting is not particularly accurate, which would insinuate their intentions for policy can adjust to the unforeseen. If the market is simply leaning against the Fed’s commitment, it is likely to converge with the official projections as they remain the course over time. Alternatively, if the markets are proven right and the Fed has to throttle back, it will most likely be due to serious economic troubles which would most likely translate into ‘bearish’ market conditions. It’s worth noting that the minutes still projected the ‘soft landing’ view as the base case.
Chart of US 2-Year Treasury Yield and Implied Fed Fund Rate for June 2023 (Daily)
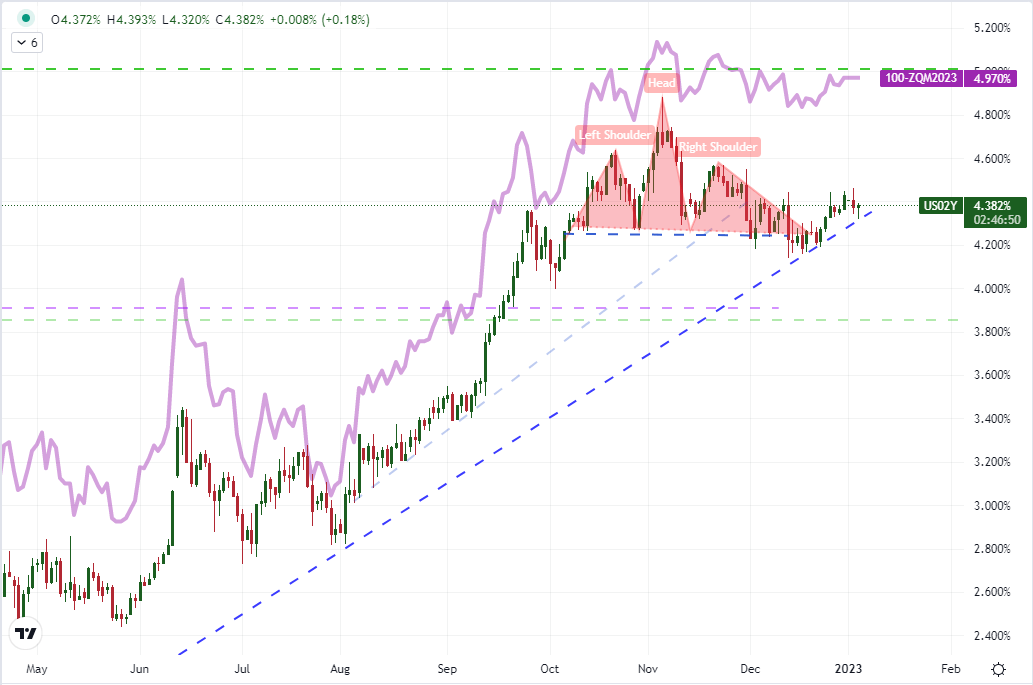
Chart Created on Tradingview Platform
In addition to the market’s disparate view on interest rate hikes over the next few meetings, there a remains a serious discrepancy in the views of policy in the second half of the year. Notably today, the implied yield forecast for the June 14th meeting via Fed Fund futures edged up to establish the slight tip in favor of 5.00 – 5.25 range, but we have seen oscillations in this vicinity whereby the ‘hawkish’ view is fleeting. What remains the greater concern for the Fed more likely is the forecasts for rate cuts in 2023. There have been two cuts generally priced in the second half of the year for a month now according to the same Fed Funds futures which either reflect the view of a policy ‘error’ or insinuate a significant problem in the economy or financial markets that would necessitate such a reversal. Neither would be welcome from a sentiment perspective.
Table of Market-Based Probabilities for Fed Fund Rates Derived from Futures
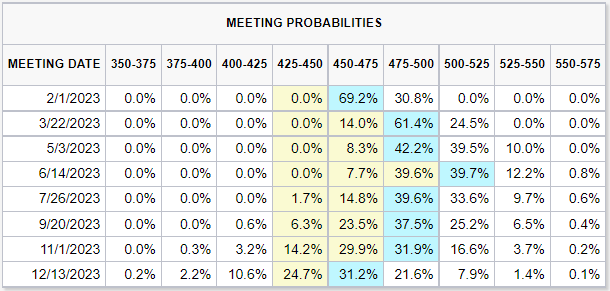
Table from CME’s FedWatch
As a bonus chart from the markets, gold prices charged through the midpoint of their past two-and-a-half year range (around 1,845) today despite the leveling out of the US Dollar and general buoyancy of market rates. Historically, this commodity has been touted as a hedge against inflation that wilts under higher interest rates (as it pointedly does not provide yield). Yet, that relationship has broken down materially after the medium-term Treasury yield (2-year) has peaked. The added weight of a very liquid US Dollar retreating may provide disproportionate liquidity to the otherwise shallow waters of the precious metal market, but how long does this outlier support last and how far does it project for the bulls? This is a relationship worth watching.
| Change in | Longs | Shorts | OI |
| Daily | 1% | -3% | -1% |
| Weekly | 2% | -8% | -2% |
Chart of Gold Overlaid with the US 2-Year Treasury Yield (Daily)
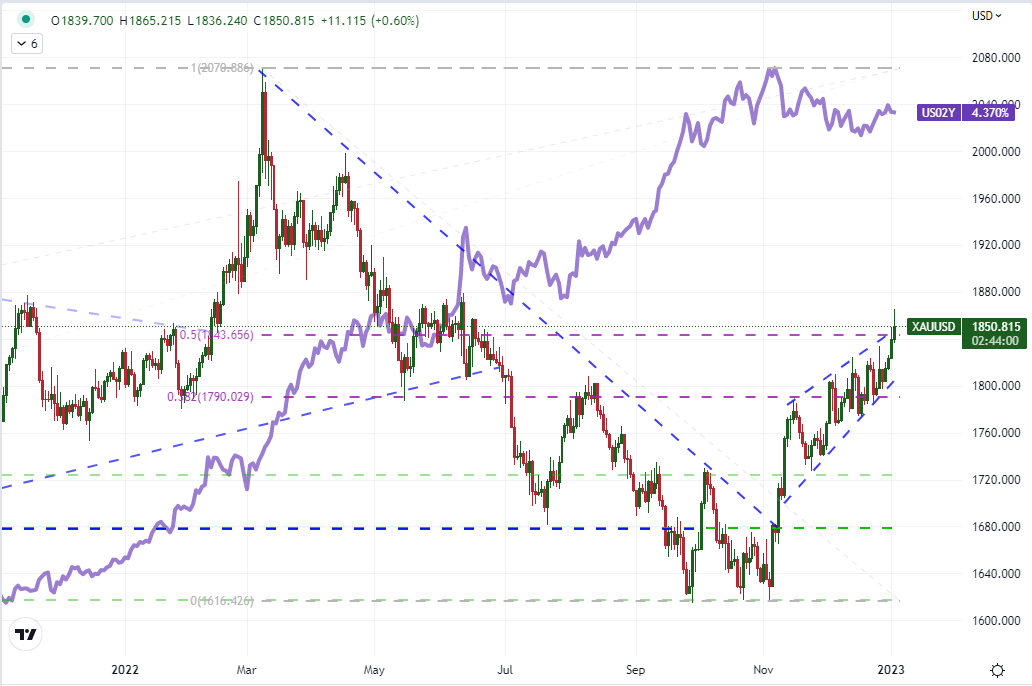
Chart Created on Tradingview Platform


