

Bitcoin (BTC/USD) Outlook:
- Bitcoin prices shrug off geopolitical risks while technical levels hold.
- BTC/USD price action continues to consolidate in a narrow zone.
- Major trendline resistance and key historic level restrict the upside move.

Bitcoin Technical Analysis
Bitcoin prices are looking to end the week in an uneventful manner as BTC/USD fails to break out of its narrow range. With daily support and resistance currently holding between $18903 and $19126 (at the time of writing), the consolidation of Bitcoin prices over recent weeks has increased the probability of a breakout.
After falling to $18183 last week, a retest of the upper bound of the descending trendline (from the Nov high) allowed bulls to edge marginally higher before running into another big barrier of resistance at $19666 (December 2017 high).
Bitcoin (BTC/USD) Weekly Chart
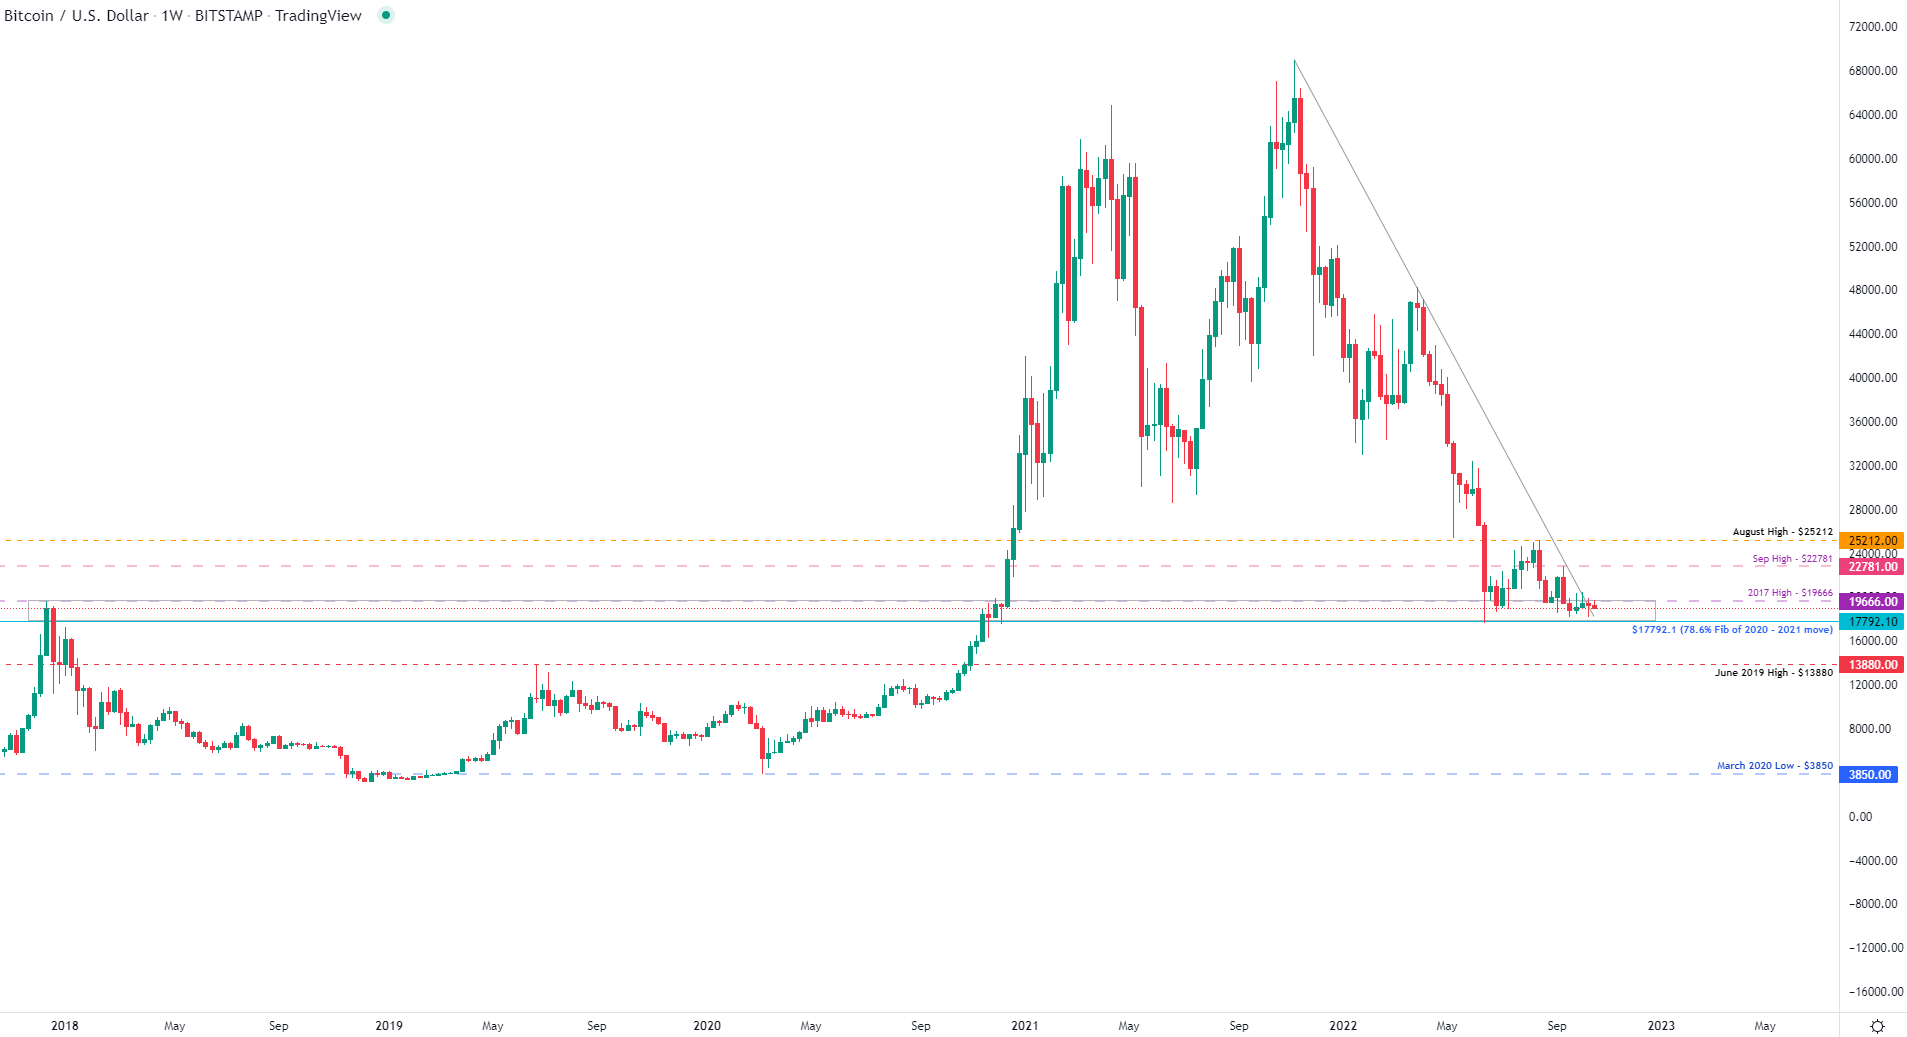
Chart prepared by Tammy Da Costa using TradingView (Data from Bitstamp)

Despite the ongoing inflation narrative and broader economic risks, BTC/USD has appeared oblivious to recent events. As both sentiment and technical levels remain prominent drivers of price action for the short and longer-term move , a break of $17792.1 (the 78.6% Fib of the 2020 – 2021 move) and $17592.78 could open the door for bearish continuation. From there, an increase in selling pressure and a retest of $16000 psychological support may allow BTC/USD to fall back towards prior resistance turned support at the June 2019 high of $13880.
Bitcoin (BTC/USD) Daily Chart
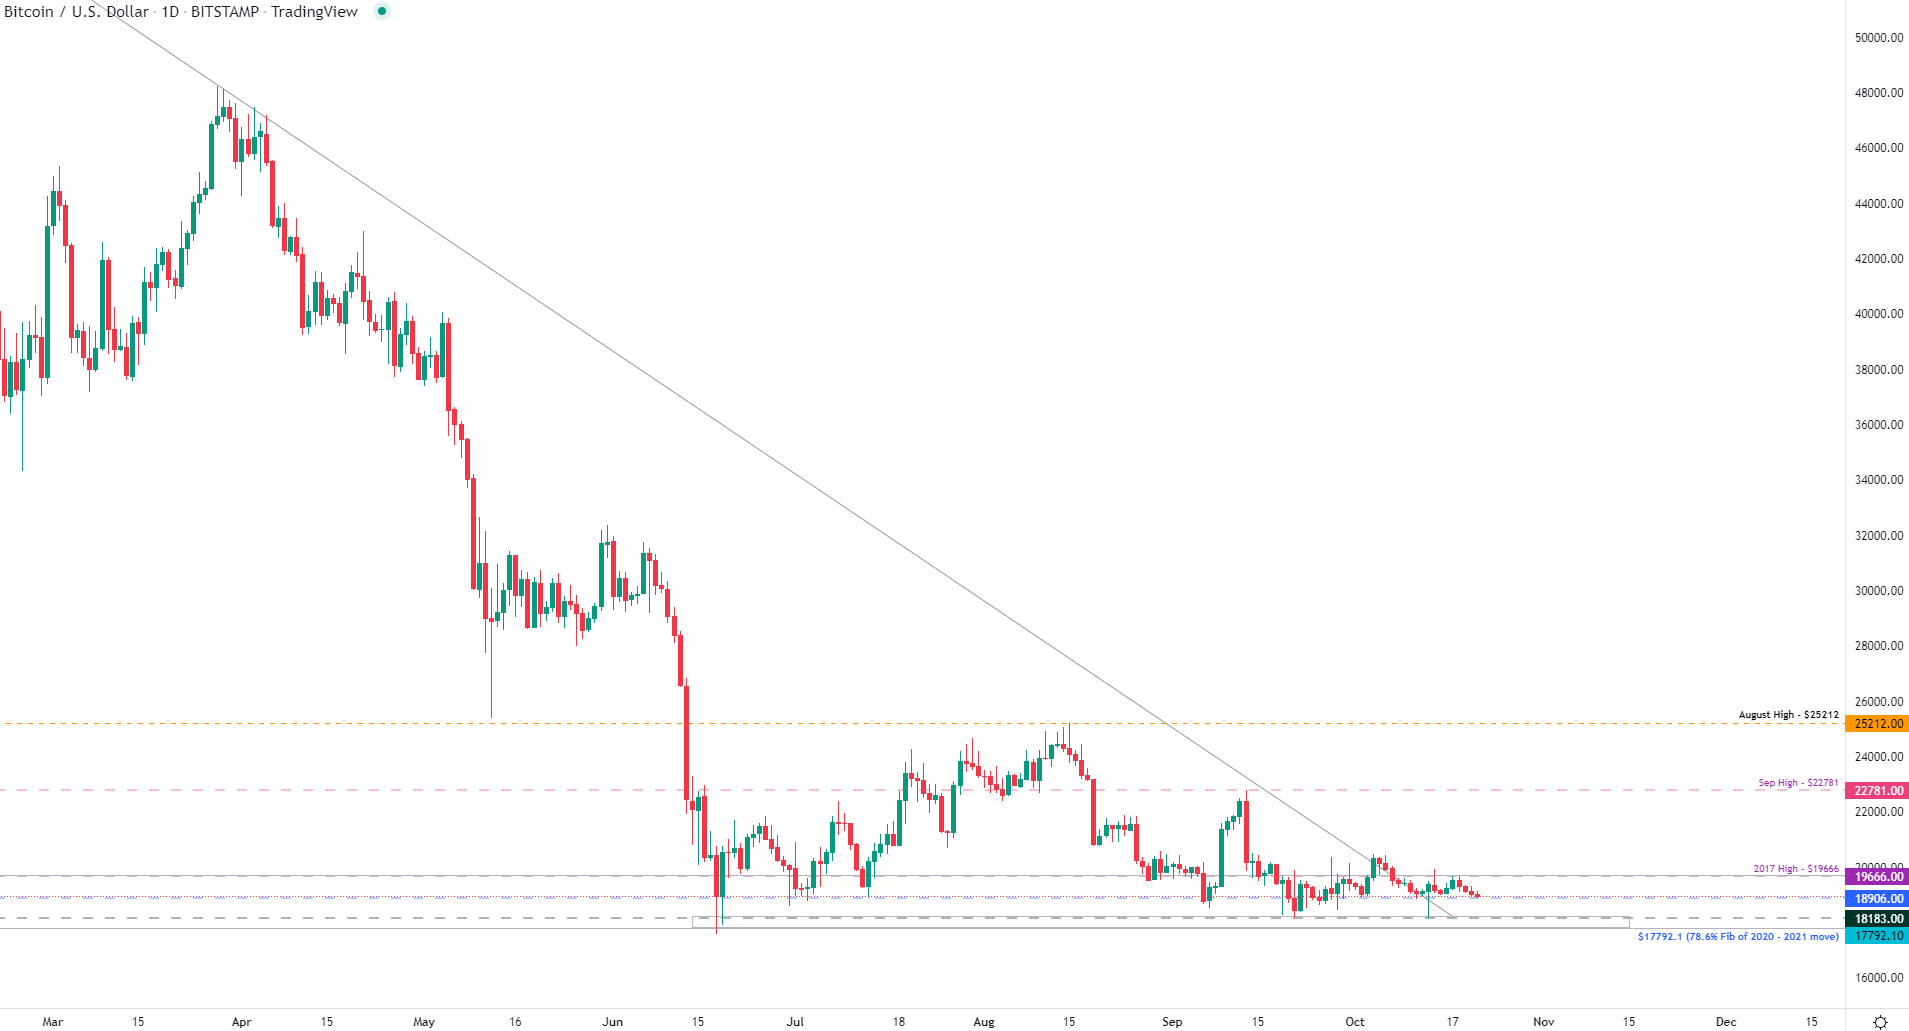
Chart prepared by Tammy Da Costa using TradingView(Data from Bitstamp)
Bitcoin Levels to Watch
| Support | Resistance |
|---|---|
| S1: 18183 (Current monthly low) | R1: 19666 (December 2017 high) |
| S2: 17792.1 (78.6% Fib of 2020 - 2021 move) | R2: 20000 (Psych level) |
| S3: 17592.78 (June low) | R3: 22718 (September high) |
--- Written by Tammy Da Costa, Analyst for DailyFX.com
Contact and follow Tammy on Twitter: @Tams707