


VIX, MOVE, GVZ, EVZ – Analyzing Volatility Around Christmas
- Traders often expect a “U-” or “V-” shaped pattern in volatility around Christmas
- Does data on the VIX, MOVE, GVZ, EVZ support this “Santa Claus Rally” theory?
- It seems that while volatility cools, there is a “double-dip” phenomenon occurring

Market conditions tend to dramatically change at the end of each year, producing seasonality. These factors include thinning liquidity, year-end rebalancing and to a certain extent, a lack of notable economic event risk. Of course, fewer market participants also raise volatility risk. So, if an acute economic or geopolitical shock occurs during this period, wild price swings can happen.
You might have come across the so-called “Santa Claus Rally” theory, which is typically defined as a push higher in equities that occurs leading into the Christmas holiday on December 25th. The latter brings up disagreements between traders and financial intuitions about which specific days/weeks such a rally could occur.
Then, as we get past the holidays, volatility should theoretically come back online, producing a “U-“ or “V-” shaped pattern”. At least, this is the general idea that most traders may have in mind. As we are about to find out, however, there is more to it than that. In fact, data over the past few decades seems to suggest that there is more of a “double-dip” or “W-shaped” phenomenon going on.
This analysis looks at popular gauges of ‘market fear’ such as the VIX, MOVE, GVZ and EVZ for equities, bond markets, precious metals and currencies, respectively. This is not a piece dedicated to explaining the intricacies of these indices. To make a long story short, if they are rising, that tends to mean there is more volatility going on and vice versa.
VIX Index Christmas Analysis
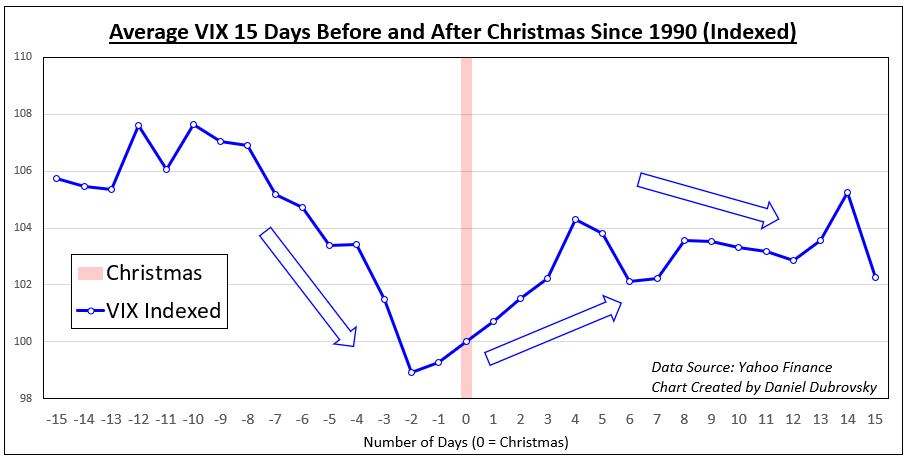
Let us begin with the most popular gauge of volatility, the VIX Index. The latter is specifically following the S&P 500, which is often used to look at general risk appetite. In the chart below, the VIX’s average performance 15 days before and after Christmas since 1990 is displayed. There seems to be a 3-step pattern that occurs each year.
The first step seems to confirm the “Santa Claus Rally” theory, and it shows the VIX cooling in the weeks leading to Christmas. Then, the second step shows volatility rising in the days after. Finally, about 4 days after Christmas, or around New Year’s, volatility cools down again, but it is very slight. What about other markets?

MOVE Index Christmas Analysis
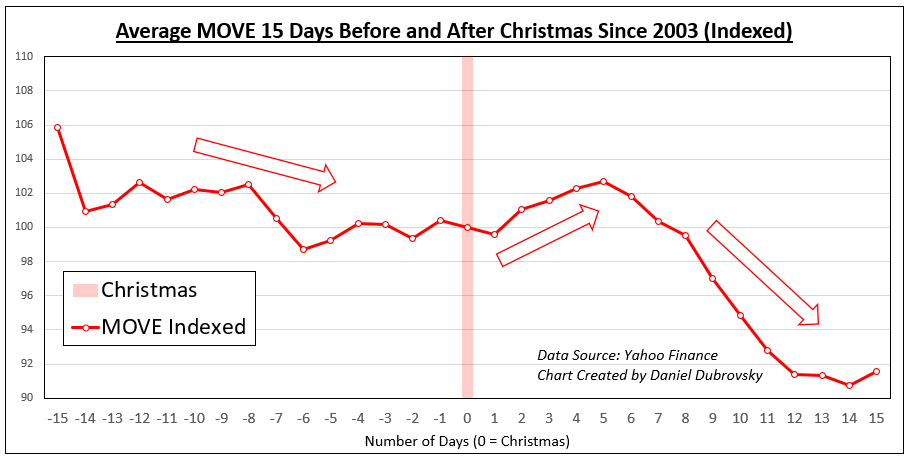
The MOVE index is essentially the bond market equivalent of the VIX, used to measure US interest rate volatility. Similarly to the VIX, MOVE tends to decline in the days leading into Christmas, on average. But, the decline is not as pronounced as the VIX. After the holiday, we see an uptick in volatility for a few days. Finally, around the 5th day, we see a second dip in volatility. The latter is more pronounced than what is seen in the VIX.
GVZ Index Christmas Analysis
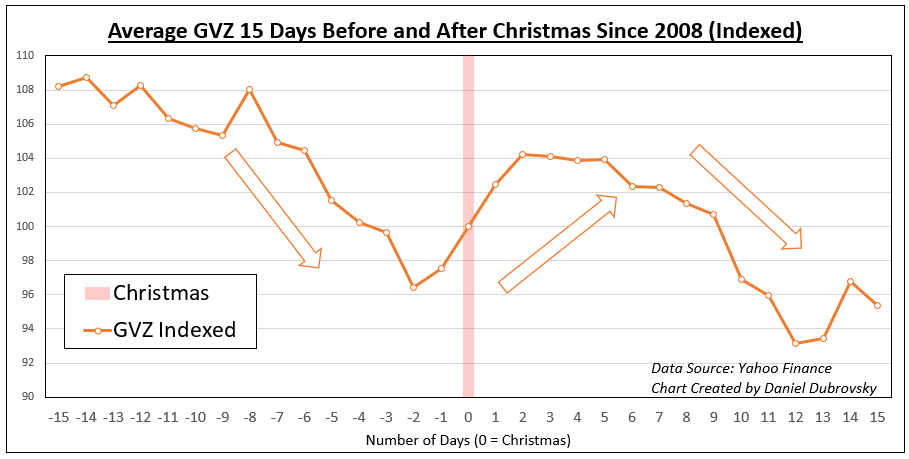
Turning to the GVZ index, which is the gold market equivalent of the VIX, the index follows an almost exact path as the MOVE. Volatility cools leading into Christmas, then there is a slight boost ending with a notable second dip in the days after New Year’s. This is not terribly surprising. Gold is an anti-fiat instrument that is closely tied to the Federal Reserve’s policy, the Treasury market, and the US Dollar.
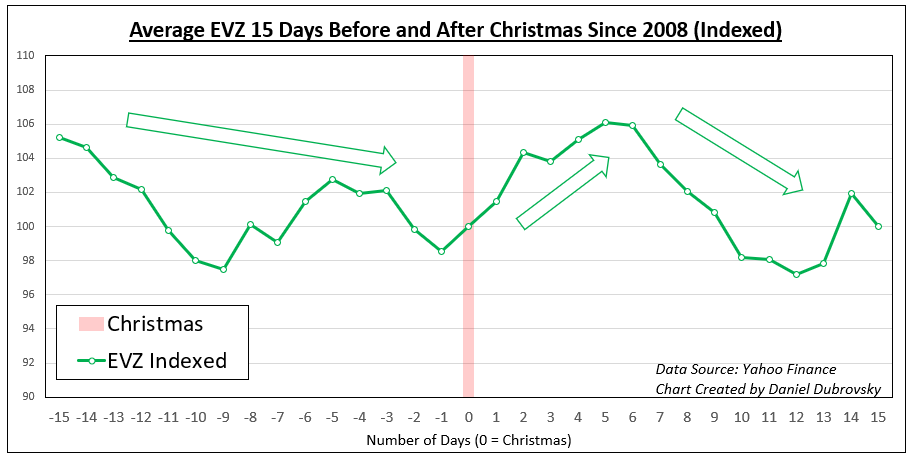
EVZ Index Christmas Analysis
Finally, let’s look at the EVZ Index, which is the Euro exchange rate equivalent of the VIX. Similarly to the MOVE and GVZ indices, the EVZ starts with a cautious dip in volatility heading into Christmas. Then, momentum picks back up before a second dip occurs in the days around New Year’s. This also makes sense as the exchange rate would typically be tied to the same dynamics impacting bond markets.
The Double Dip in Market Volatility Around Christmas
As we saw, there is more to it than just a “V” or “U” pattern in market volatility around Christmas. Between stock, Treasury, precious metal and currency markets, we tended to see a second round of price action cool in the week or so following Christmas. That produced a “W” pattern. In some cases, it was as profound, or stronger, than the cooldown before Christmas. Keep in mind that past performance is not indicative of future outcomes, but this seasonality seems to hold over time.
Trade Smarter - Sign up for the DailyFX Newsletter
Receive timely and compelling market commentary from the DailyFX team
--- Written by Daniel Dubrovsky, Senior Strategist for DailyFX.com
To contact Daniel, follow him on Twitter:@ddubrovskyFX


