


Major US indices eked out small gains to start the week, but it may be nothing more than an attempt to stabilise from recent sell-off, given the absence of a fresh bullish catalyst for now. The US 10-year yields continued its relentless rise to a fresh 16-year high above the 4.55% level while the US 30-year yields head to 4.67%. The US two-year yields saw more muted moves (+2 basis-point), with some unwinding of the inverted yield curve lately reflecting some accustoming to a high-for-longer market stance.
While we still tread amid the seasonally weaker period of the year, the tendency for the US government shutdown to drag for longer (potentially past the 1 Oct deadline) and lingering China’s housing woes remain as immediate headwind for markets to digest. Overnight, the US dollar found the conviction for a fresh 10-month high, seemingly setting its sight on the 106.84 level next. Latest CFTC data also revealed that the aggregate positioning for US dollar against other G10 currencies has reversed into net-long positioning for the first time since November 2022. The higher-highs-higher-lows formation since July this year keeps an upward bias intact for now, with the 105.00 level serving as immediate support to hold.
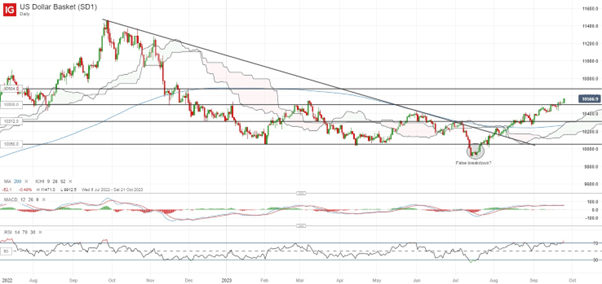
Source: IG charts
On the economic calendar ahead, focus will be on the US new home sales and consumer confidence data today. Given the recent jitters around the high-for-longer Fed rate guidance, a more lukewarm reading may be preferred to offer more policy flexibility for the Fed in deciding whether to go ahead with its last rate hike.
Asia Open
Asian stocks look set for a negative open, with Nikkei -0.89%, ASX -0.44% and KOSPI -1.12% at the time of writing, tracking the weaker showing in US equity futures. Higher bond yields and a firmer US dollar did not provide much conviction for risk-taking for now and to add to the downbeat mood, fresh liquidation order for developer China Oceanwide and ongoing China Evergrande’s debt-restructuring woes suggest that the worst-is-over for China's property sector is far from being seen.
Chinese equities have unwound most of their last Friday’s gains, with the Hang Seng Index down close to 2% in yesterday’s session. The index has been attempting to defend the key 61.8% Fibonacci retracement level of its previous reopening rally, but seems to lack the fresh catalysts to do so. Some dip-buying was seen last week with the formation of a weekly dragonfly doji, but any failure to defend last week’s low may potentially pave the way to retest the 16,524 level next, where the next Fibonacci level stands. Greater conviction for buyers may have to come from a move back above its Ichimoku cloud on the weekly chart, which it has thus far failed to do so since July 2021.

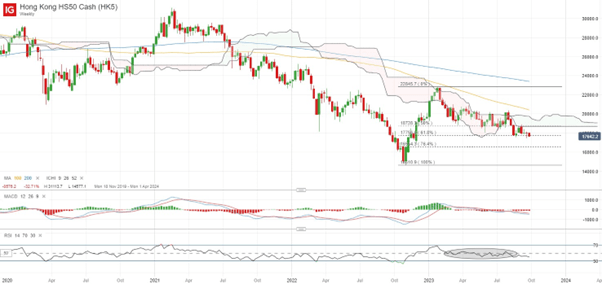
Source: IG charts
Ahead, Singapore’s industrial production data will be due today. Given the 20.1% contraction for Singapore's non-oil domestic exports (NODX) in August, the industrial production is expected to mirror the weaker global demand with a 3.1% contraction. That may reiterate the downbeat growth outlook for Singapore, with sentiments likely to track the global risk environment lower.
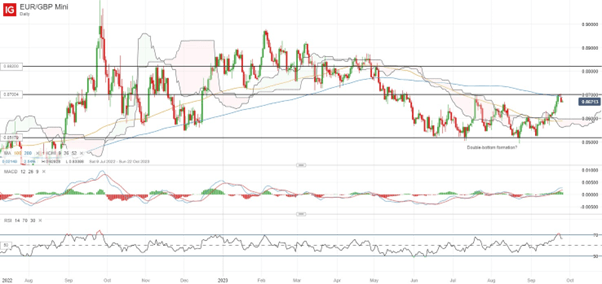
On the watchlist: EUR/GBP retesting neckline of double-bottom formation
The EUR/GBP has been trading on a double-bottom formation since May this year, with the attempt for an upward break of the neckline at the 0.870 level finding some resistance overnight. Nevertheless, on the weekly chart, a bullish crossover has been formed on its Moving Average Convergence/Divergence (MACD), while its weekly Relative Strength Index (RSI) has also crossed above the key 50 level for the first time since April 2023, which may reflect buyers trying to take back some control.
This comes as the pair has reclaimed its 100-day MA last week, after failing to overcome it on previous three occasions since May this year. Greater conviction for the bulls will still await for the neckline breakout above the 0.870 level, where its 200-day MA stands as well, with any success on that front potentially paving the way to retest the 0.882 level next.
| Change in | Longs | Shorts | OI |
| Daily | 1% | -10% | -3% |
| Weekly | 51% | -24% | 14% |
Source: IG charts
Monday: DJIA +0.13%; S&P 500 +0.40%; Nasdaq +0.45%, DAX -0.98%, FTSE -0.78%


