


Gold Price Talking Points:
- Global yields continue to drop towards zero - or in many cases deeper into negative territory
- This collapse may certainly reflect in part extreme monetary policy, but it is also a statement on growth fears in one way or another
- As recession fears and financial stability risks rise arise from this unfamiliar source, gold may be the best signal and haven
See how retail traders are positioning in Gold relative to key Indices and Currencies using the DailyFX speculative positioning data on the sentiment page.
Yields are Garnering More Attention for Recession Fears
Though we have seen an unusual amount of attention to 'yield curves' these past few months, the headlines dedicated to the topic this week was perhaps the most substantial on the topic that we have seen in many years. The inversion of the 10-year and 2-year US Treasury yields on Wednesday was the first instance of this abnormal condition that we have seen since 2007. And, while this specific spread would jump back above the zero line this past session, the implications of the shift have already been integrated into the market's psyche. The '2-10 spread' is a financier favorite, but we have already seen the market's and media's interest peaked with the rollover of the difference between the 10-year and 3-month tenors. There is certainly interesting detail to draw from the implications of these two curves, but the big picture is the same: there is either financial or economic upheaval in the backdrop. Either these signals are reverting to their historical recession signals or it is a by-product of extreme monetary policy, which theoretically is pursued to prevent a similar crisis. Ultimately, plenty of reason to be concerned about what the future holds.
Chart of US 10-Year to 2-Year Treasury Yield Spread (Daily)
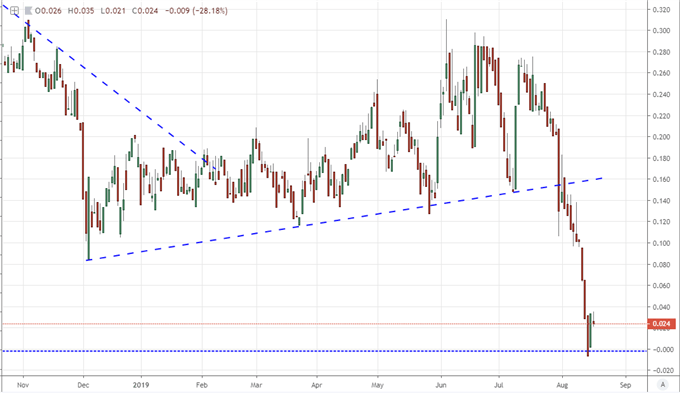
Chart Created Using TradingView Platform
Traditional Capital Markets and Even Havens Are Unsuitable
As we see these typically arcane recession signals flashing warning signs, investors are in turn sent to seek possible shelter. An systemic economic or financial threat would typically bolster the appeal of these very assets that are being referred to as risk signals. Yet, what is more troubling in US, German, Japanese and UK government bonds (among many more) exploding - which in turn drives their yields lower - is that these usual havens take on far more perspective as financial pressure points than actual havens. The world's largest central banks have distorted the structure of the preferred harbor for capital and may have created a separate problem. If we are facing serious recession risk, were would we look for safety. The preference for favorite benchmarks like US indices is a reflection of risk appetite and complacency. They will not continue to charge higher if risk aversion kicks in. They Yen may be a relative benefactor in the FX market but it is not itself a global haven. What is truly unsettling in the extreme monetary policy environment we currently occupy is that it is not clear where safety can be reliable found.
Chart of S&P 500 with Aggregate Gov’t Yield in Purple and Inverted Gold in Orange (Daily)
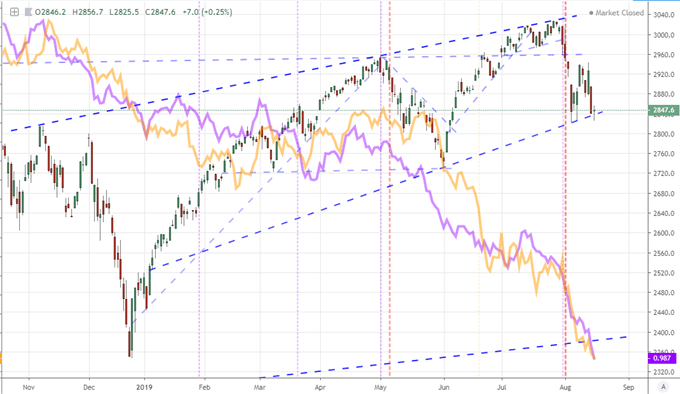
Chart Created Using TradingView Platform
Gold Is the Best Signal and Hedge for These Troubling Conditions
Yet, we have tested the scenario that we face to some extent over the previous decade. It just so happened that we first sought traditional safety in the risk aversion around the Great Financial Crisis and then latter we saw the rise of the large-scale asset purchase programs (LSAP, also known as stimulus or QE) follow to accelerate rather than ensure growth. In the second phase of this progression, between 2008 and 2011, gold prices surged to their record highs. Combining these two factors at the same time - rather than sequentially - would likely leverage the appeal of the precious metal. We already see the results of this anticipation in the commodity's climb these past months. Pushing multi-year highs that show a clear bias to climb when risk is sweeping in but resilient to a questionable recovery, we are offered a more reliable signal to the headlines of yield curves or the economic fear they reflect. What's more, this is probably the best positioned haven among the major assets that we can expect.
Chart of Equally-Weighted Gold Index with Consecutive Candle Count (Weekly)
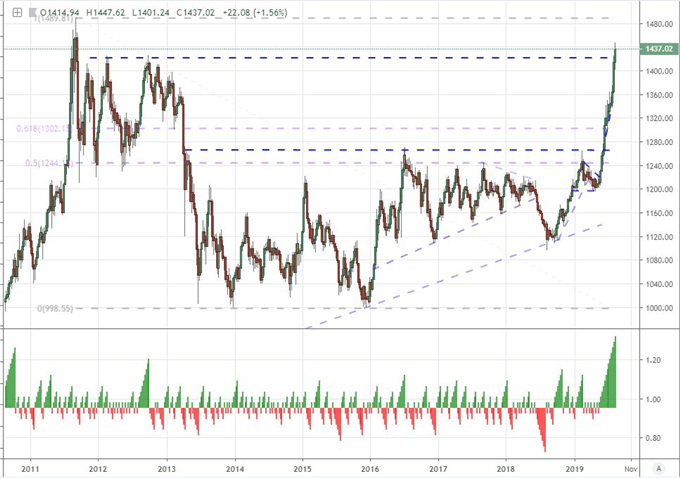
Chart Created Using TradingView Platform
If you want to download my Manic-Crisis calendar, you can find the updated file here.
Watch the US GDP release and its impact on the market live with Senior Currency Strategist Christopher Vecchio, CFA starting 15 minutes before the official release. Sign up for the event on the DailyFX webinar calendar.


