Dollar Talking Points:
- Volatility ended 2018 strong and has opened 2019 at the same tempo, which raises the potential of moves like breaks and reversal
- Reversals are a favorite development for most traders but meaningful examples are also infrequent occurrences
- We evaluate the probability of tentative reversal signals from the S&P 500, Dollar, the Loonie and Oil gaining serious traction
See what the DailyFX analysts expect from the Dollar, global equities, crude oil and other key markets through the first quarter in the updated forecasts on the DailyFX Trading Guides page.
Reversals are a Favorite for Red-Blooded Traders but They are Infrequent
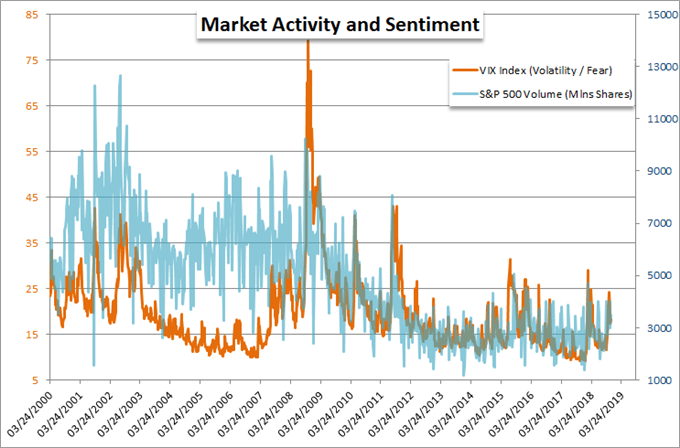
There are a few market conditions and scenarios that most traders will flock to when seeking a quick and lucrative profit. Volatility is one of the more amorphous but tantalizing market conditions for which traders are on constant look out. An increased pace is seen as a boon because it can produce more significant returns more quickly if properly timed and projected. Yet, the increase in pace often comes hand in hand with an uncertainty of direction; and that is particularly important for successful trading. The real coup for the active trader is picking up on a meaningful reversal. A substantial shift in direction after a lasting one-sided move insinuates critical timing and can encourage an acceleration in a specific direction. That is the ideal. The problem, however, in this pursuit is the infrequent nature of such developments. Some of the elements can show without staging a lasting follow through or a reversal can begin without actually producing the valuable trend. And, most of the time we are either in consolidation or prevailing trends. We need to account for the low instance of true, meaningful reversal by raising our criteria for selecting them and boosting the risk/reward ratio of pursued patterns as much as possible. Amid the extreme volatility witnessed these past months and the evolution of an unmistakable risk aversion theme, there are some tentative signs in various corners of the market of possible reversals. Are they reliable and/or are they lucrative enough to indulge? We take a look at some of the most prominent.
Chart of S&P 500 Volume and VIX Volatility Index (Weekly)
The Filters and Crude Oil's Incredible Dive
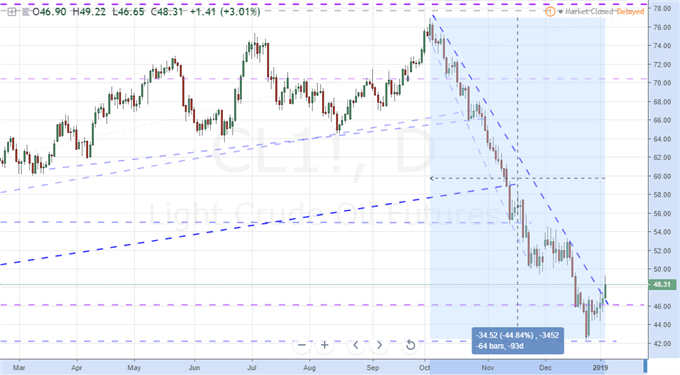
There are numerous qualifiers that we can use to help identify reversals, but generally they fall into three categories: technical, fundamental and conditional. Most traders will put he emphasis on the charts and that can often be the timeliest signal when the turns are genuine. However, patterns can also be the most misleading. Fundamentals is in contrast far more reliable for securing a trend as it can show that there are common, dominant themes around which the masses can build their intent. Conditional factors are the least appreciated in normal circles; but the backdrop for positioning, volume and volatility elements that don't fit neatly into other categories are very often the most systemic. With these filters in mind, one of the most high profile possible reversals amongst the most heavily traded assets is arguably the US-based WTI crude oil market. After three months of seemingly unrelenting plunge - whereby the commodity shed approximately 45 percent from its 2018 peak - we finally have a bullish technical break of note. The multi-month plunge formed an impressively clear descending trend channel which the market finally managed to close above this past week. This is what most traders would place all of their confidence behind. Yet, there are other considerations. Speculative positioning has seen an extreme drop in the record net long from 2018 which could have unwound too far, too fast. Fundamentals on the other hand are less convincing as risk trends and global growth trends (the demand side) are not as encouraging. A reversal seems more probable here than with most assets, but it still has its crucial caveats and requires necessary milestones.
Chart of US Crude Oil Futures (Daily)
Habitual Canadian Dollar Trends, an S&P 500 Turn Fighting Back Fear, the Inevitable Dollar Break
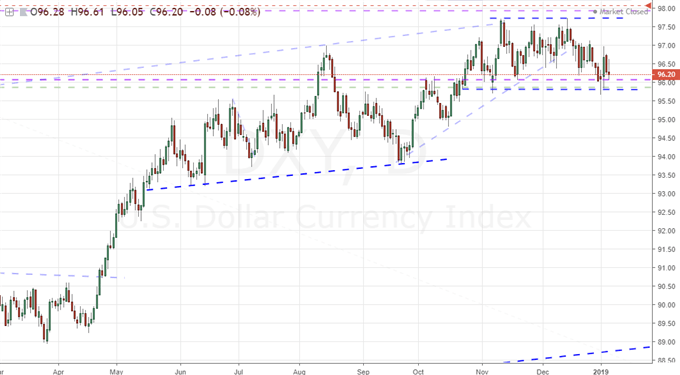
Elsewhere, we have markets that are clearly less intense in how stark the charts look, but their virtues in other areas could offset the 'potential' shortfall with a 'probability' boost. From the Canadian Dollar, the rebound this past week would come after an impressively consistent multi-month bearish trend channel. Looking to an equally-weighted measure of the currency, we find that it has a habit of developing remarkably clear trends - bullish and bearish. The conditional factors are somewhat dubious as liquidity and volatility do not benefit the shift. A correlation to crude oil and a discount in interest rate expectations can present a strong motivation on the other hand to keep the charge progressing. The S&P 500 on Friday marked its own important mile marker in a turn. Surpassing 2,520 meant breaking a well-formed resistance and former critical support in the October-December tumble. Conditional factors are not as supportive as the persistent high in volatility of late holds negative correlation to risk trends and liquidity filling in will only raise the pressure. Fundamentals are outright dubious to supporting the move as the downgrade in growth forecasts, the failings of global monetary policy and the deterioration in political stability with events like the government shutdown will act as a constant threat - not certain failure of risk trends but something that will at best seriously curtail progress. And then there is the Dollar. The DXY Index and EURUSD have established clear consolidation patterns these past few months on the back of often-uneven bullish Dollar (bearish EURUSD) trend dating back to early 2018. Here, we haven't actually seen the break, but clearance is highly likely as volatility in price action is rising while the range is abnormally tight for such a long period. The fundamental motivation is unclear as the market weighs Fed intent, it is unclear if it is preferred as carry or haven, and the outlook for growth and political support are critically uncertain. That said, a break will come. We weigh what it takes to evaluate reversal candidates with four high profile examples in this weekend Quick Take video.
Chart of Equally-Weighted Canadian Dollar Index (Daily)
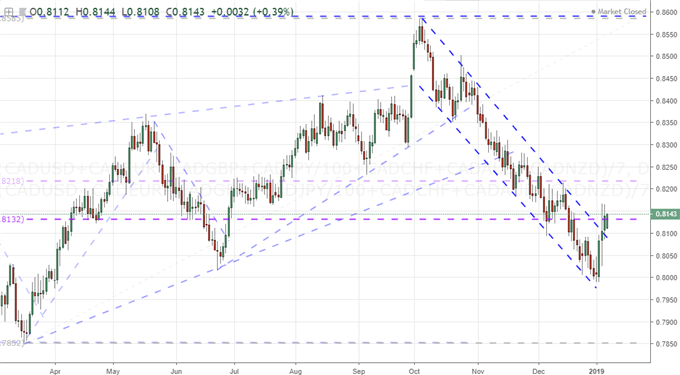
Chart of the S&P 500 (Hourly)
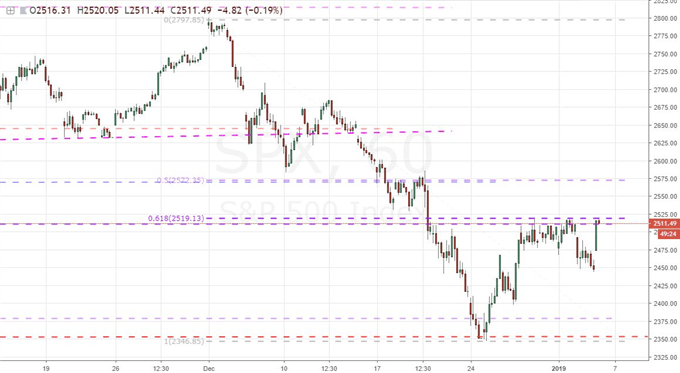
Chart of the DXY Dollar Index (Daily)
