


US Dollar, FOMC Talking Points
- This is a webinar archive of this morning’s mid-week market check-up, in which FOMC was the focal point of the analysis.
- The US Dollar has put in a surprising spate of strength so far in 2021, backed by an exuberant rise in Treasury yields. Today marks the first set of updated forecasts out of the Fed this year, and the big question is how the bank might perceive this recent move in yields and the threat of higher inflation.
- The analysis contained in article relies on price action and chart formations. To learn more about price action or chart patterns, check out our DailyFX Education section.
The March FOMC rate decision is around the corner and the big question is how much the bank will adjust projections after a strong jump in US yields so far in 2021 trade. The yield on 10-year Treasury notes has risen by as much as 80% so far in the first 2.5 months of 2021. For its part, the US Dollar has shown a surprising bullish move to go along with that run in rates, but as shown in this morning’s mid-week check-up, that 2021 rally has been but a 23.6% retracement of last year’s bearish move. This makes it a bit easier to qualify this scenario as a counter-trend pullback in terms of a bigger-picture backdrop of US Dollar weakness.
The big question at this point is whether the Fed will prod the US Dollar lower. To be sure, Jerome Powell has continued to offer a passive take towards policy, with little indication of any near-term tightening. But, with data continuing to improve and with inflationary fears coming from areas like Lumber or Copper prices, and with the S&P 500 near a recently established all time high – how much more dovish can he be?

US Dollar Weekly Price Chart
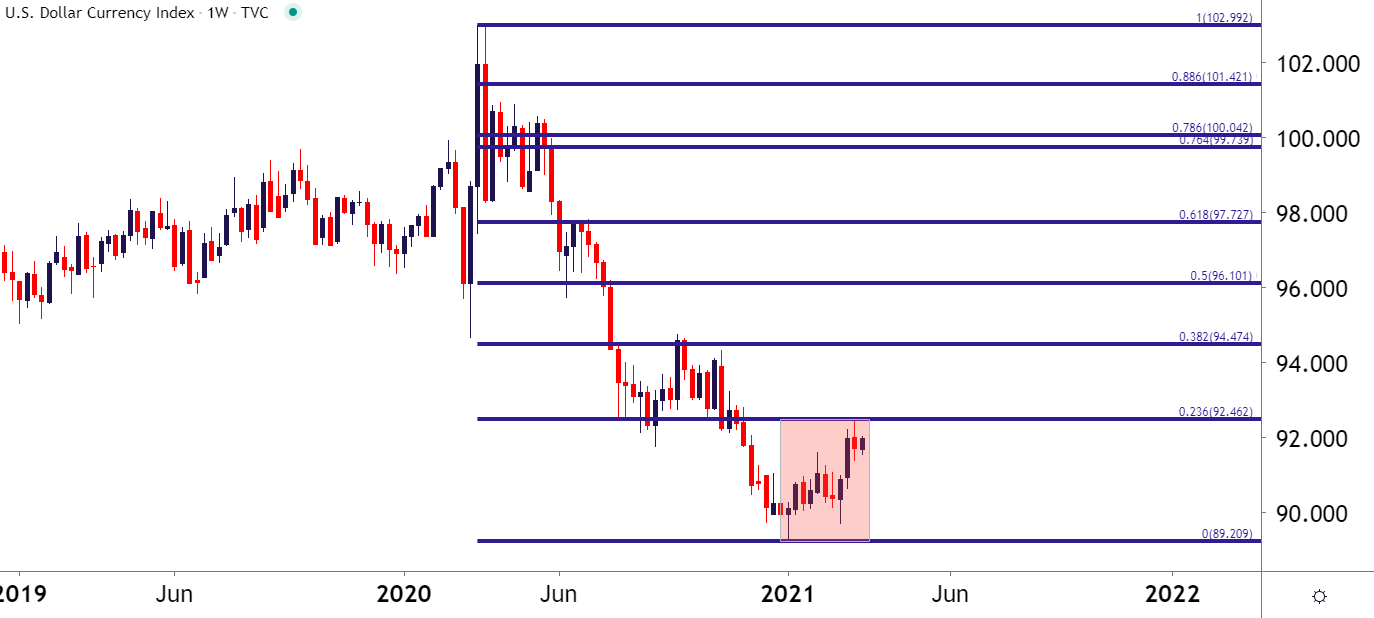
Chart prepared by James Stanley; USD, DXY on Tradingview
From a shorter-term basis, there is possible scope for a continued move-higher, and if Powell does what he’s been doing by avoiding the elephant in the room (rising rates, inflation fears) then we may get a continuation of what’s been happening. As looked at in yesterday’s webinar, short-term USD shows an ascending triangle formation, often approached with the aim of bullish breakouts.
To learn more about ascending triangles, join us in DailyFX Education
US Dollar Four-Hour Price Chart
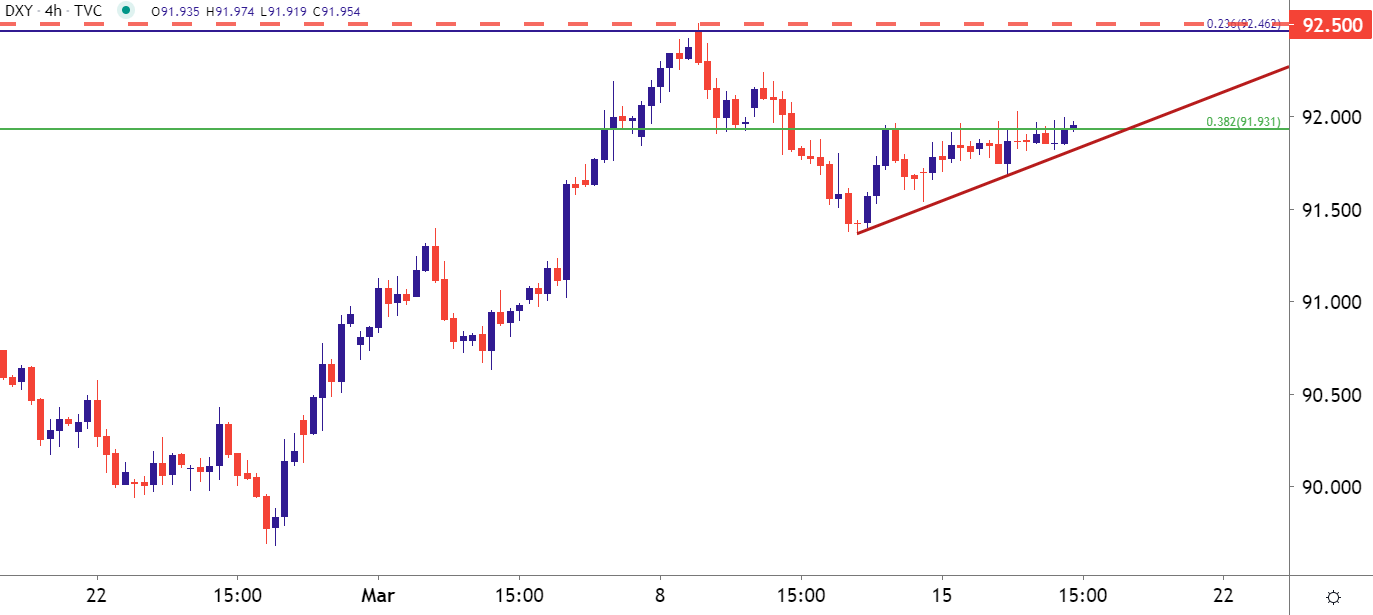
Chart prepared by James Stanley; USD, DXY on Tradingview
EUR/USD Bull Flag
Going along with that pullback in the USD bearish trend, EUR/USD has put in a pullback in its own bullish trend. This has taken on the form of a bull flag formation, often approached with the aim of continuation of the longer-term trend.
For those looking for USD-weakness scenarios, there may be greener pastures elsewhere, namely GBP/USD or AUD/USD, both of which carry breakout potential ahead of the Fed.
To learn about bull flag formations, join us in DailyFX Education
EUR/USD Weekly Price Chart
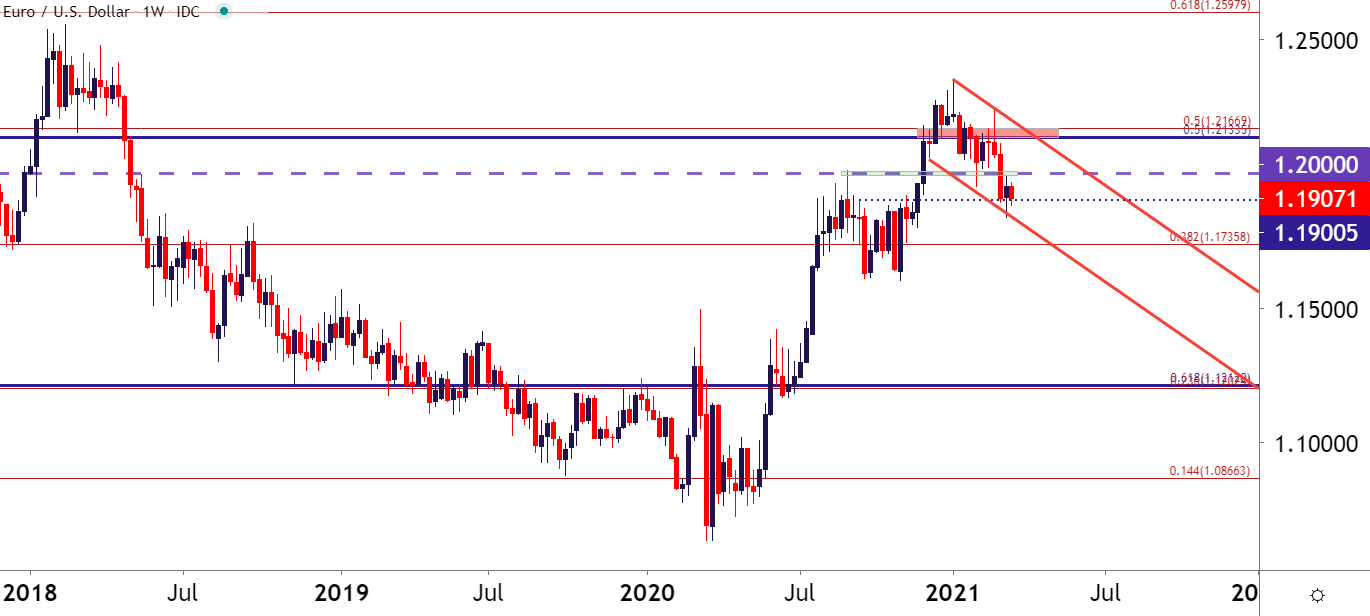
Chart prepared by James Stanley; EURUSD on Tradingview
GBP/USD Trend Channel to 1.4000 Psychological Level
While that EUR/USD trend has been on pause for most of 2021, GBP/USD has been chugging higher for most of the time, only recently pulling back. But – that pullback has found support at the 23.6% retracement of the September-February bullish move; and the longer-term trend channel remains intact.
To learn more about Fibonacci, check out the Fibonacci sub-module inside of DailyFX Education
GBP/USD Daily Price Chart

Chart prepared by James Stanley; GBPUSD on Tradingview
As noted above, Cable carries some breakout appeal given the numerous tests at the 1.4000 level that, so far, have yet to fly (pun intended). This keeps the door open for a breakout beyond the psychological level, and for traders that are looking for a re-emergence of USD-weakness, this may be a more attractive scenario to follow going into FOMC.
But – note – tomorrow does bring a Bank of England rate decision, so the volatility is likely to continue in GBP-pairs through that event.
To learn more about psychological levels as support/resistance, join us in DailyFX Education
GBP/USD Two-Hour Price Chart

Chart prepared by James Stanley; GBPUSD on Tradingview
--- Written by James Stanley, Senior Strategist for DailyFX.com
Contact and follow James on Twitter: @JStanleyFX


