


US Dollar Price Action Talking Points:
- The US Dollar is in a pretty messy state at the moment, especially from short-term vantage points.
- The bullish trend in USD/JPY has been one of the cleaner recent moves around the USD – which could make USD/JPY as an optimal candidate for USD-strength and/or make the Yen as an optimal currency for weakness if looking to marry it up with a strong currency (such as GBP or AUD).
- The analysis contained in article relies on price action and chart formations. To learn more about price action or chart patterns, check out our DailyFX Education section.
The US Dollar is in a pretty messy state at the moment, especially from the perspective of short-term charts. And while the general consensus coming into this year on stocks has largely been ‘right,’ expecting the speculative fervor to continue – the same consensus around the US Dollar, expecting the currency to continue falling – has not.
The Greenback punched down to a fresh low in the first week of the New Year, but a surprising spurt of strength developed shortly after. It looked like sellers might be making a return last week, as the USD again tested below the 90-level before another spurt of strength developed in the latter portion of last week – and that’s held through the March open so far.
In this webinar, I remarked that the US Dollar is in a messy state, and it may not be until the FOMC rate decision in two weeks until the currency begins to clean up its act. As we saw last week, even as Chair Powell shared that he was anticipating the Fed sitting on low rates until absolutely necessary, rates markets appeared to be a bit unnerved as Treasury yields continued to climb.
US Dollar Daily Price Chart: USD Bears Await
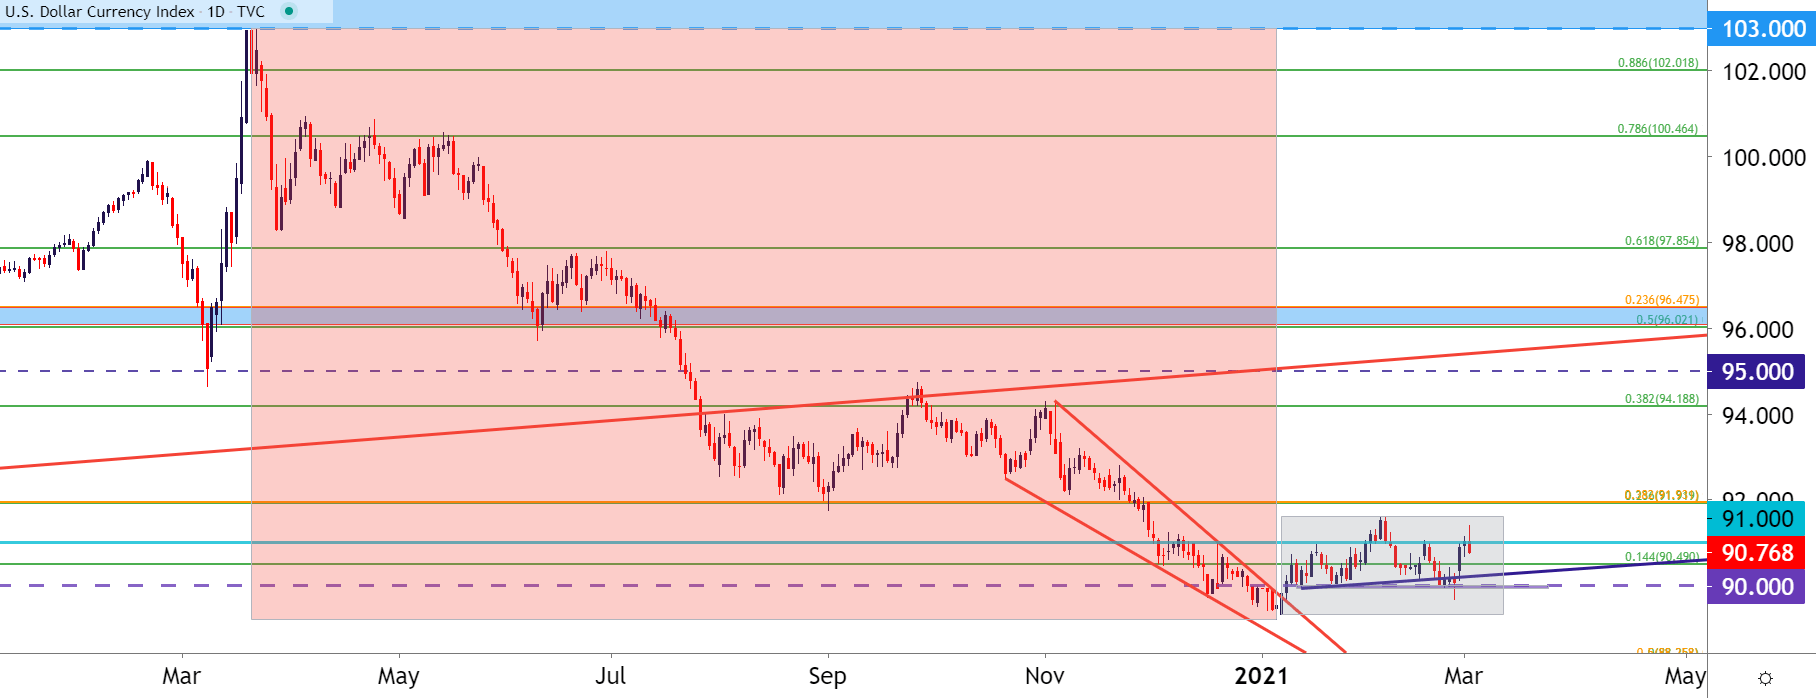
Chart prepared by James Stanley; USD, DXY on Tradingview
Perhaps one of the cleaner trends around the US Dollar at the moment is against the Japanese Yen, which opens the door to using short-side JPY plays in-place of the US Dollar, particularly for traders that have currencies in which they’re expecting strength. This would be similar to the scenario I had looked into early last month in AUD/JPY, just before the pair broke out. And there could be some continuation potential there should the risk-on theme continue.
At this point, the pair made a stern run at the 85.00 psychological level but has so far been unable to overtake it. This level looms large as that next spot of resistance on the chart.
To learn more about psychological levels, check out DailyFX Education
AUD/JPY Weekly Price Chart

Chart prepared by James Stanley; AUD/JPY on Tradingview
USD/JPY Attempts to Set Support at a Big Level
It’s probably surprising that one of the cleaner USD trends has been in USD/JPY. But, the pair has continued to impress as buyers have backed the bid. The past two days have seen another level re-enter the equation at 106.65, as this is the 38.2% Fibonacci retracement of the 2011-2015 major move in the pair.
To learn more about Fibonacci retracements, check out this recently launched sub-module within DailyFX Education
USD/JPY Weekly Price Chart
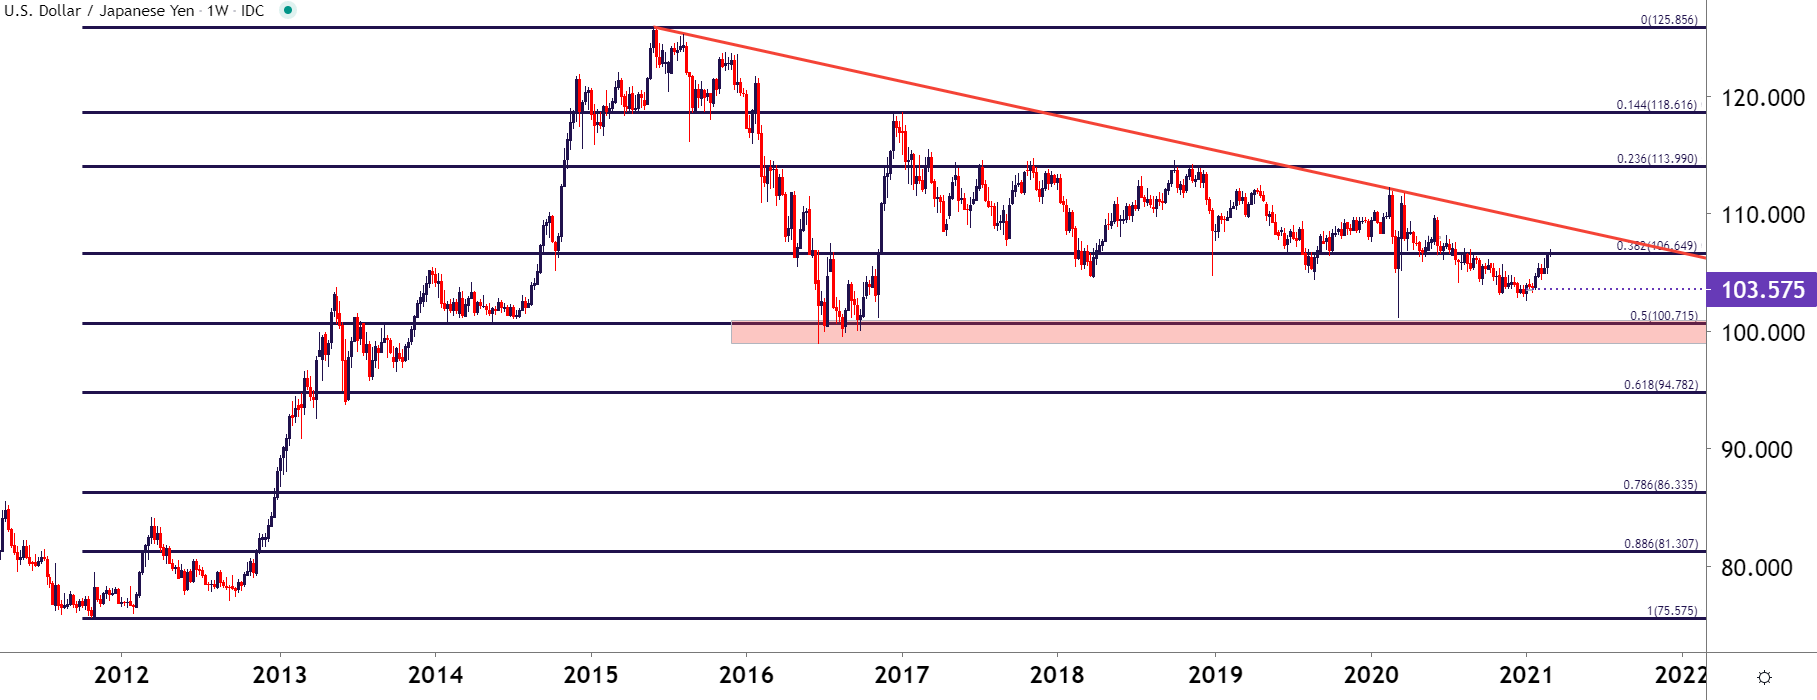
Chart prepared by James Stanley; USD/JPY on Tradingview
On a shorter-term basis, we can see where buyers are attempting to hold higher-low support around this longer-term Fibonacci level. After functioning as resistance last week, buyers pushed in a fresh high; and a pullback has since found a few hours of support at this level, which is confluent with a trendline, keeping the door open for continuation theses.
To learn more about drawing trendlines, check out DailyFX Education
USD/JPY Hourly Price Chart

Chart prepared by James Stanley; USD/JPY on Tradingview
GBP/USD Checks Back to Trend Support
I had written about this one yesterday, looking to GBP/USD and the bullish trend as a manner of looking for USD-weakness. Price action in the pair had tested a confluent spot on the chart, spanning around a Fibonacci level and a trendline that’s so far helped to hold the low.
This can keep the bullish trend in the pair to allow for short-side USD strategies. But – in full transparency, as I shared in the webinar, there could be a short-term reversal setup inside of this longer-term bullish trend. The big item there is the 1.4000 psychological level.

GBP/USD Daily Price Chart

Chart prepared by James Stanley; GBPUSD on Tradingview
--- Written by James Stanley, Strategist for DailyFX.com
Contact and follow James on Twitter: @JStanleyFX


